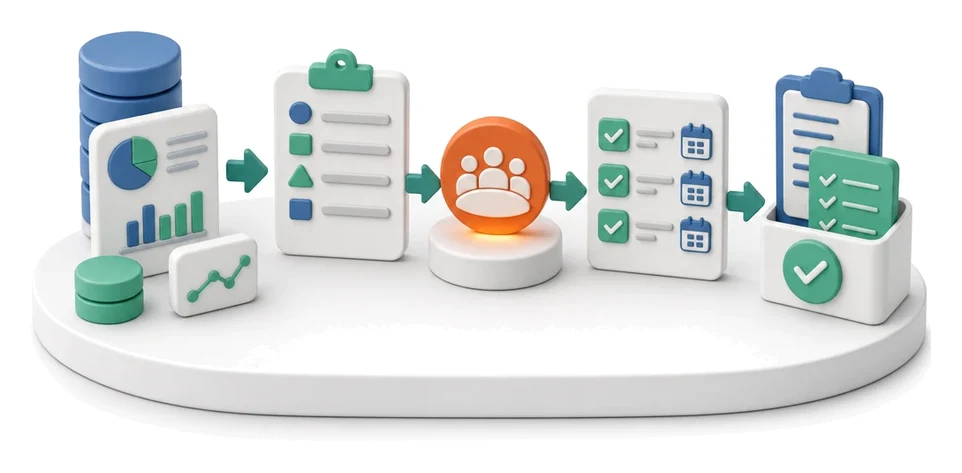
Plan vs Actual Control
Do you wait until year-end close to see how far reality drifted from your budget? The Finance module lets you track plan vs actual month by month, giving instant visibility into variances. Artificial intelligence automatically generates summaries in the AI Reports tab, helping you interpret financial data faster.
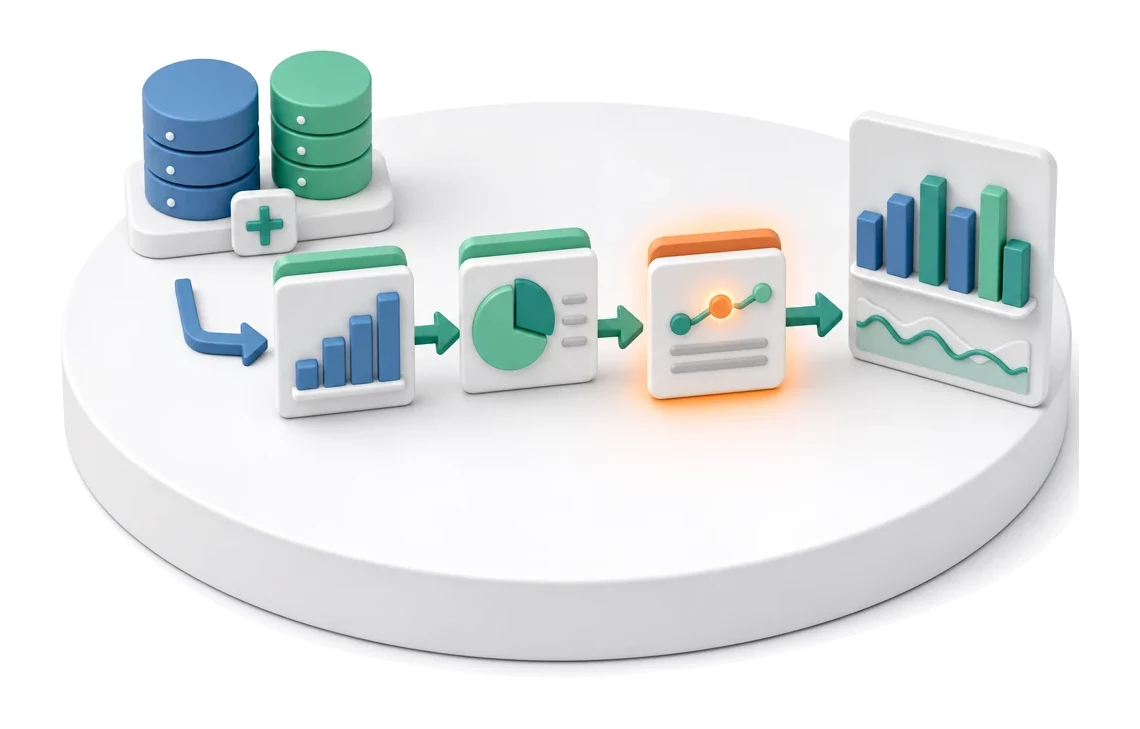
- Input
- Budget + actual data
- Flow
- Budget → month actuals → variance and commentary
- Output
- Plan vs actual comparison
What changes in the company after the rollout
Actuals are compared to budget month by month. Variances are visible immediately, not only after year-end close.
Fast issue identification
You see budget variances immediately during the month, not only after the financial year is closed.
Better financial visibility
You gain a full picture of the situation thanks to clear tiles summarising income, expenses and net result.
Immediate reaction
Notifications about critical variances let you take corrective actions quickly and minimise losses.
Easier KPI control
Weekly and monthly tables make it easier to continuously track progress against your financial targets.
Time savings
All plan and actual data is in one place, with no need to manually recalculate spreadsheets.
How this process looks in Process App
Zrzuty pochodzą z działającego systemu — kliknij, aby powiększyć.
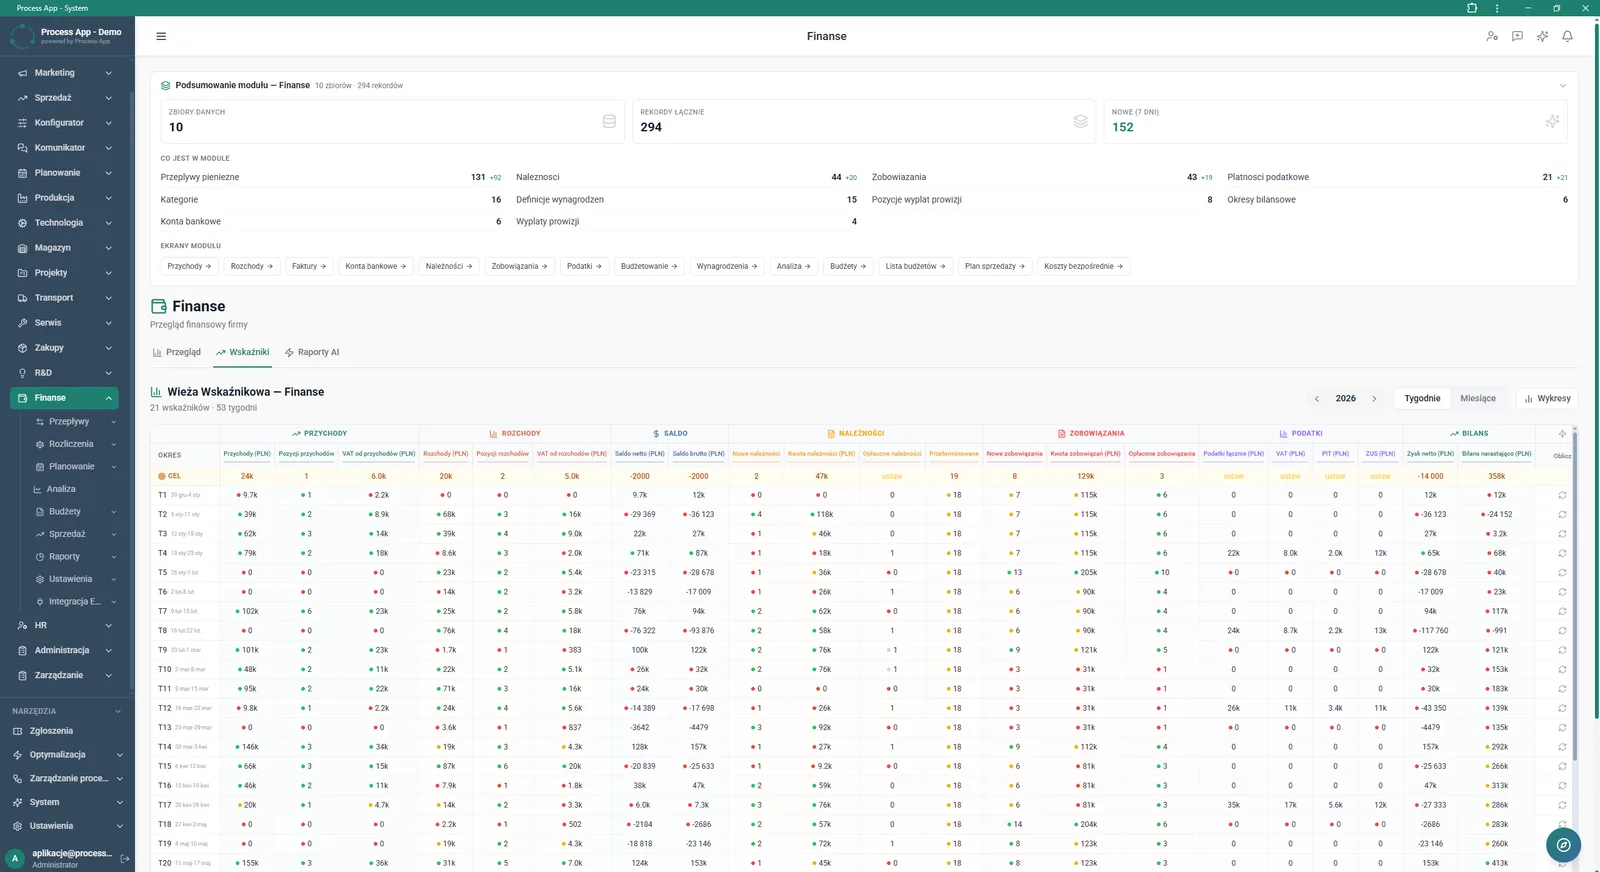
Finance module screen showing a data summary and the Indicator Tower table with weekly income, expenses, balance, receivables, liabilities, taxes and balance sheet overview.
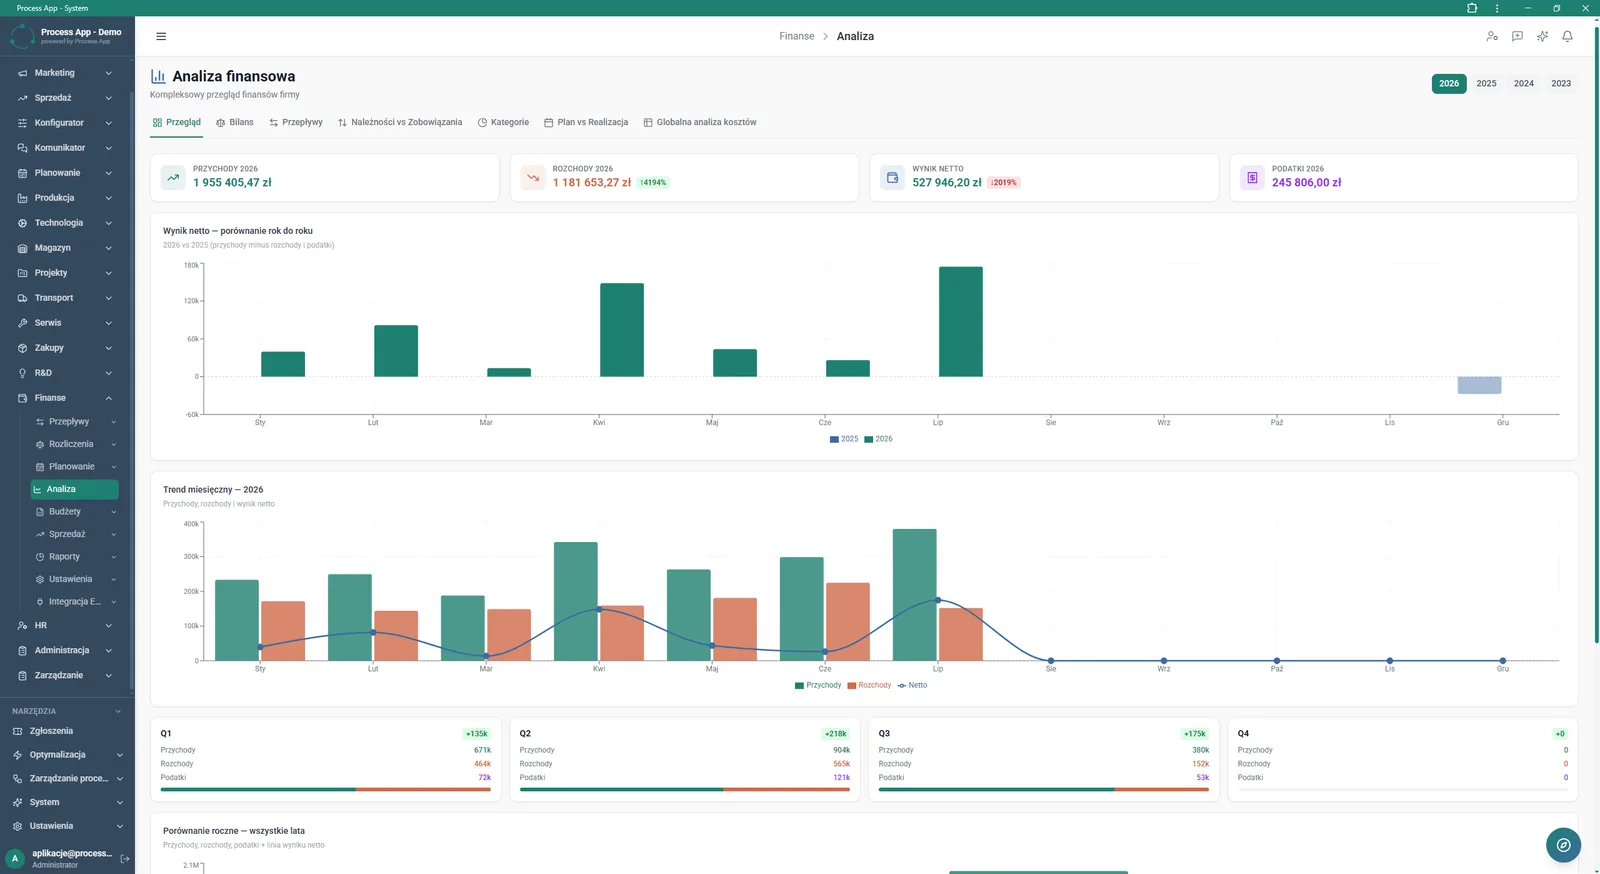
Financial Analysis screen in the Finance module presenting a view of financial KPIs, year-on-year comparison charts, monthly trends and quarterly summaries.
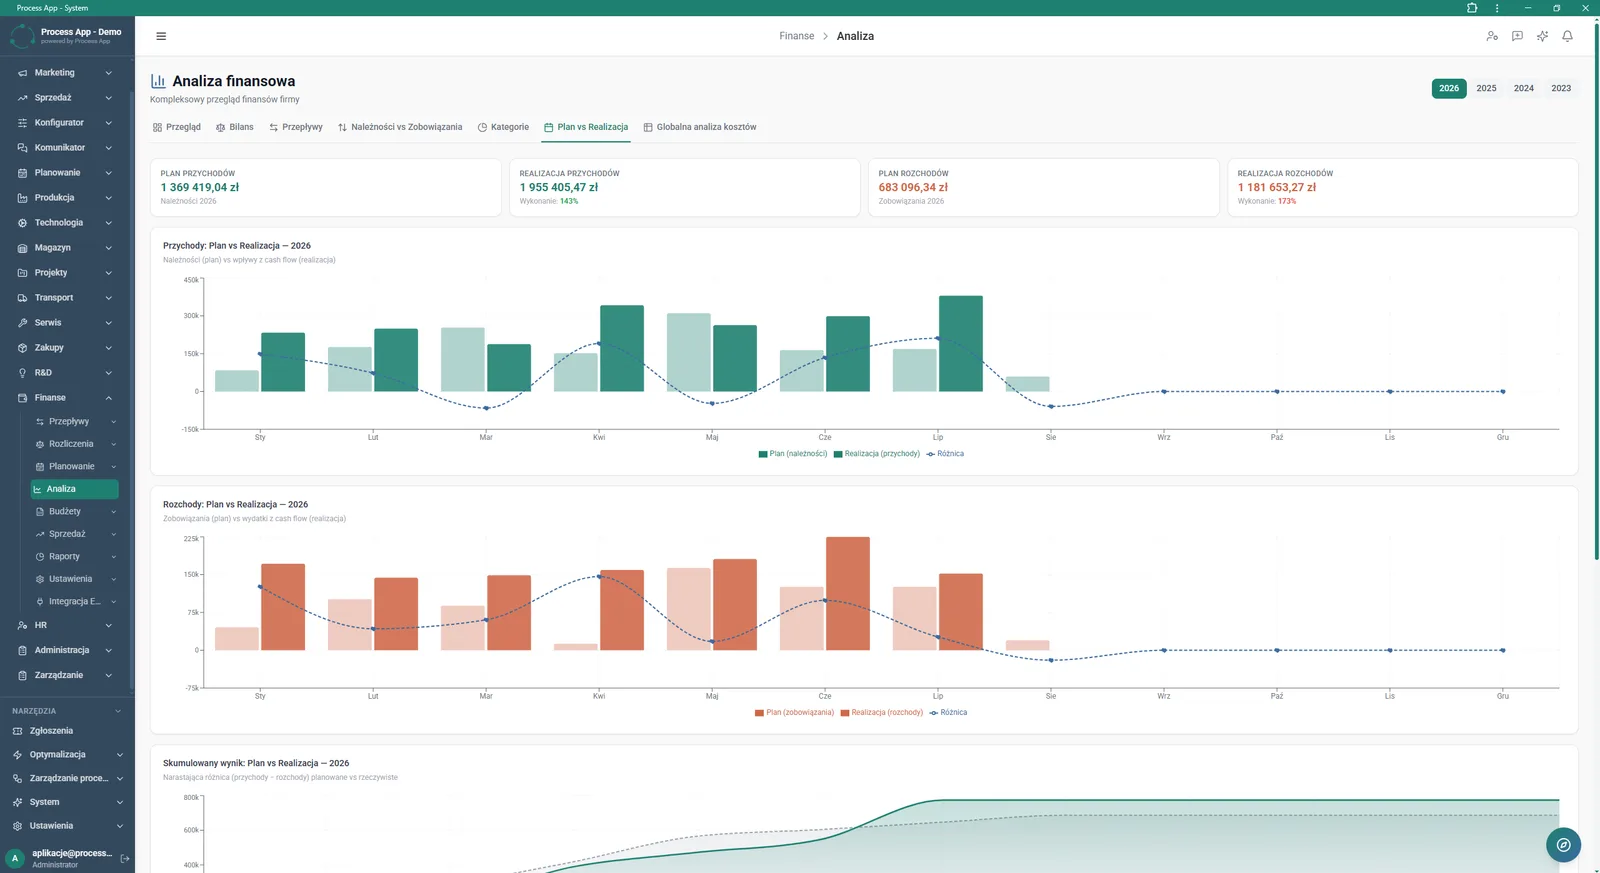
Financial Analysis screen in the Plan vs Actual tab showing tiles with summaries of planned and actual values and charts comparing income and expenses month by month.
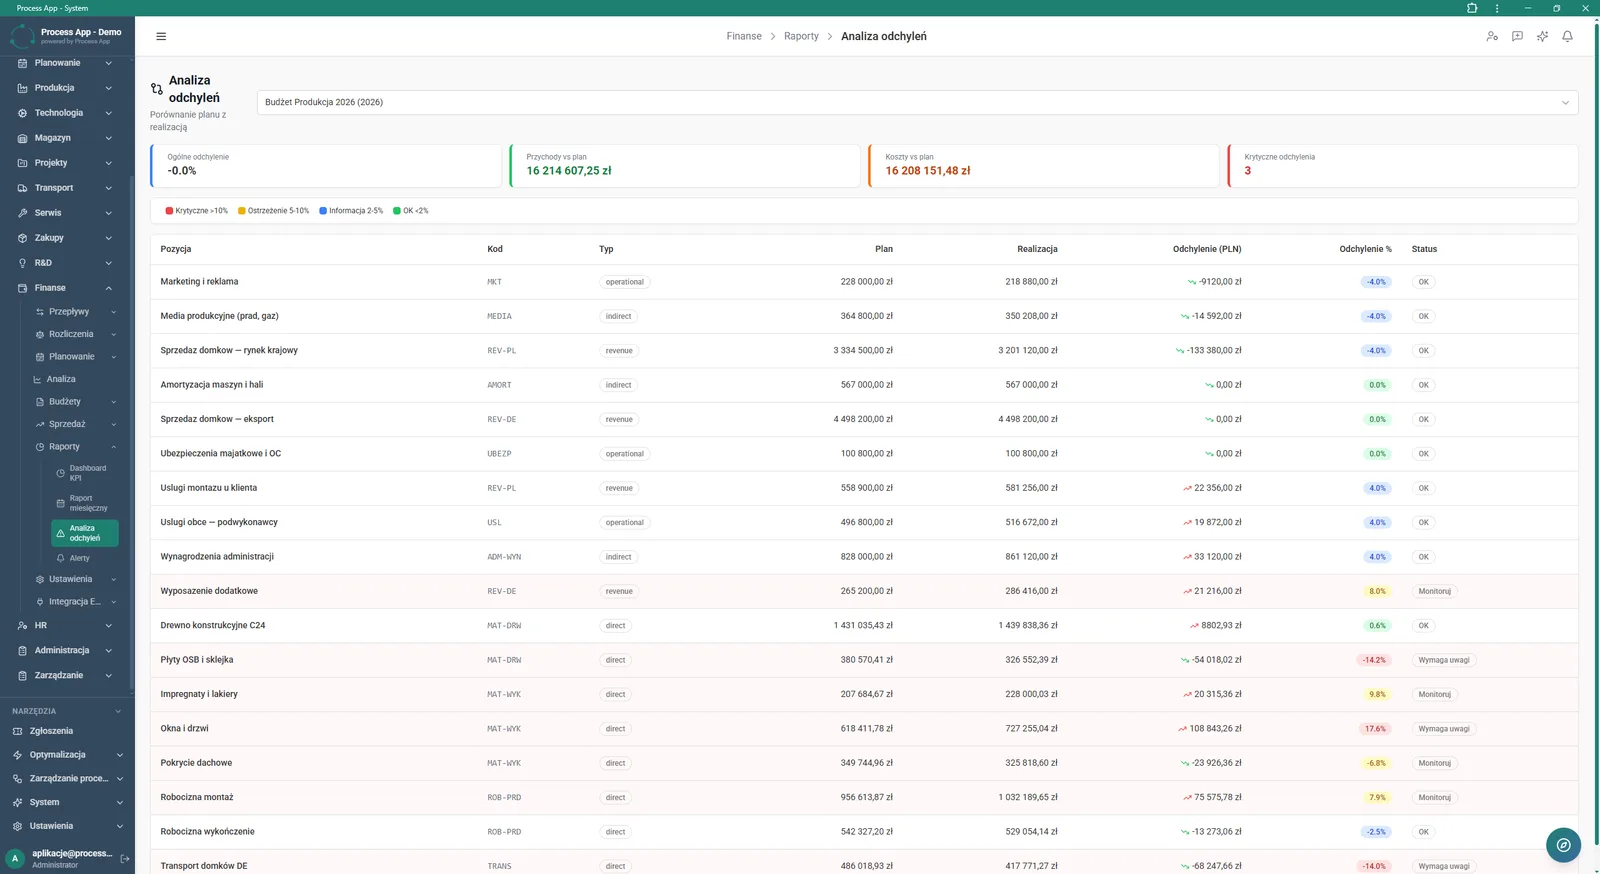
Variance Analysis screen in the Finance module presenting a tabular comparison of plan vs actual for individual budget lines, along with tiles summarising total variance, income and costs.
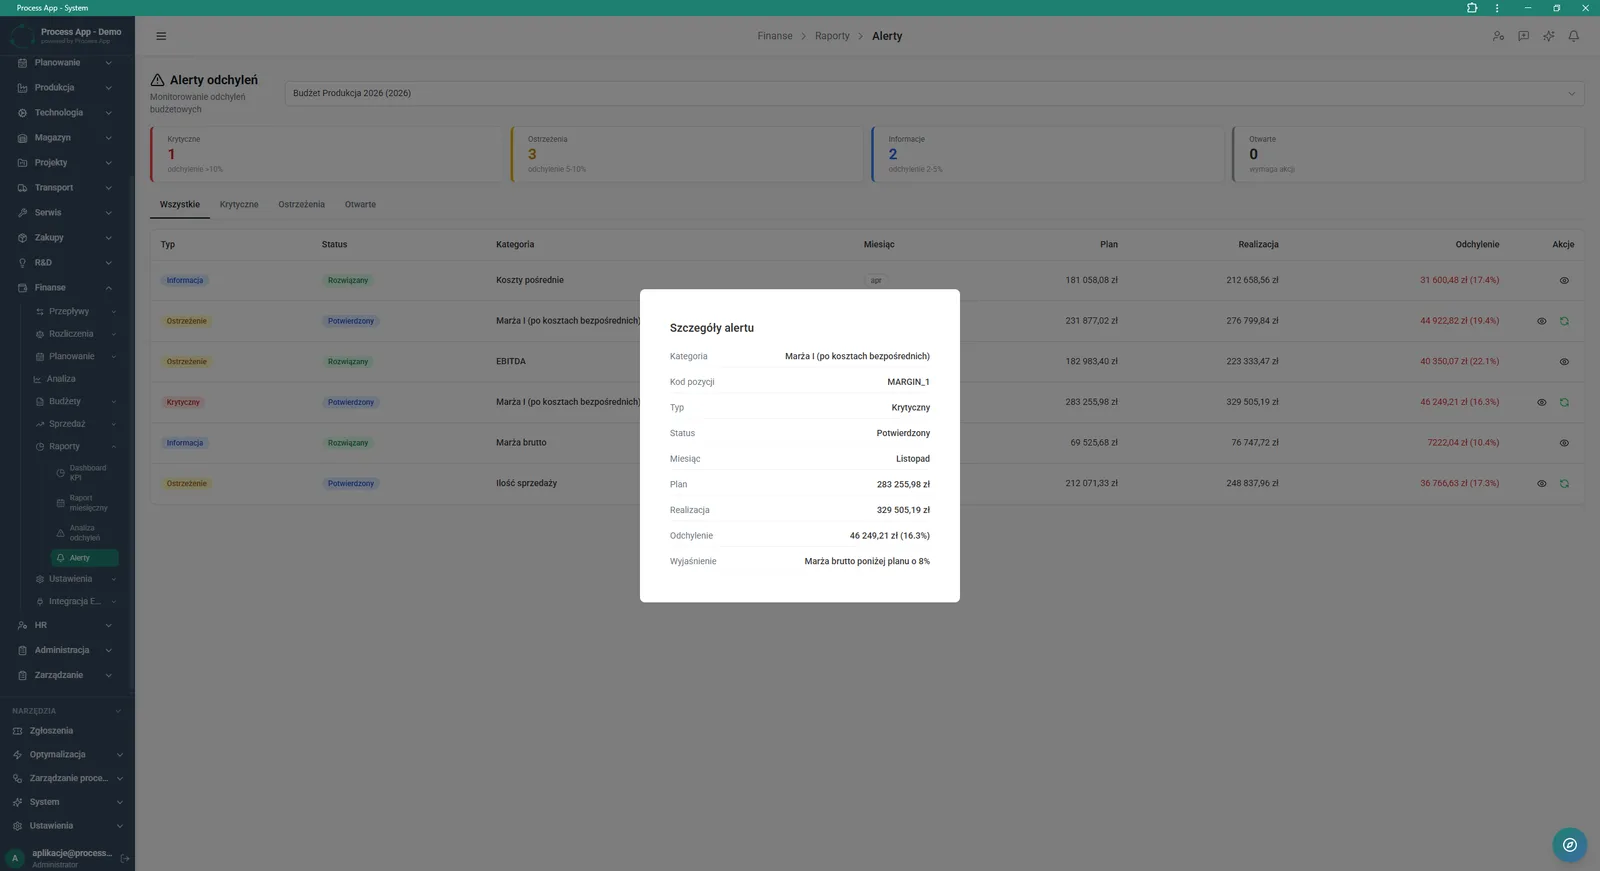
Variance Alerts screen in the Finance module showing a list of budget alerts by severity and an open window with details of a selected critical alert.
What exactly you get
Plan vs actual comparison
The system compares planned and actual values on charts broken down by individual months.
Indicator Tower table
The application presents a summary of income, expenses, balance and taxes with the option to switch between weekly and monthly views.
Budget variance analysis
The module calculates value and percentage variances for individual budget lines and assigns the appropriate status.
Variance alerts
The system generates a list of budget alerts classified as critical, warning or informational based on percentage overruns.
Comparative charts
The application generates monthly trend charts and year-on-year comparisons of financial results.
Alert details
A modal window displays full information on category, item code, plan, actuals, variance and allows you to add an explanation.
What AI does for you in this process
Intelligent reporting
AI analyses collected financial data and provides ready-made summaries in the dedicated AI Reports tab.
Trend analysis support
AI analyses monthly trend charts and year-on-year comparisons, making it easier to interpret results quickly.
Variance classification
AI analyses differences between plan and actuals, supporting the categorisation of alerts into critical and warning.
The process from start to finish
Control budget execution in real time using dedicated screens in the Finance module. Switch between views in the Plan vs Actual tab to compare income and expenses month by month on clear charts. Drill into detailed breakdowns in the Variance Analysis screen, where you immediately see value and percentage differences for each budget line. Check variance statuses and monitor which ones are marked as Needs attention or Monitor. Use the Indicator Tower table to track income, expenses, balance and taxes on a weekly or monthly basis. Browse the list in the Variance Alerts screen to react instantly to critical budget overruns and open the Alert details window to verify root causes.
See this process on your own data
We will walk you through the “Plan vs Actual Control” module using your company as the example — the input, the flow and the end result in Process App.
Explore the remaining system modules

Sales Invoicing
Annual Budgeting (P&L)
Month-End Close
Recruitment
Employee Onboarding
Working Time and Time & Attendance Records

Leave and Absence Management
Competency Matrix Management
Strategic Planning (JPS)
Cascading Goals and KPIs
KPI Monitoring