Cascading Goals and KPIs
Do your employees struggle to see how their daily work links to the company’s strategic goals? The KPI cascading module translates management’s vision into concrete KPIs for business units and operational levers at workstation level. Artificial intelligence analyses the biggest KPI shifts and supports forecasting target achievement.
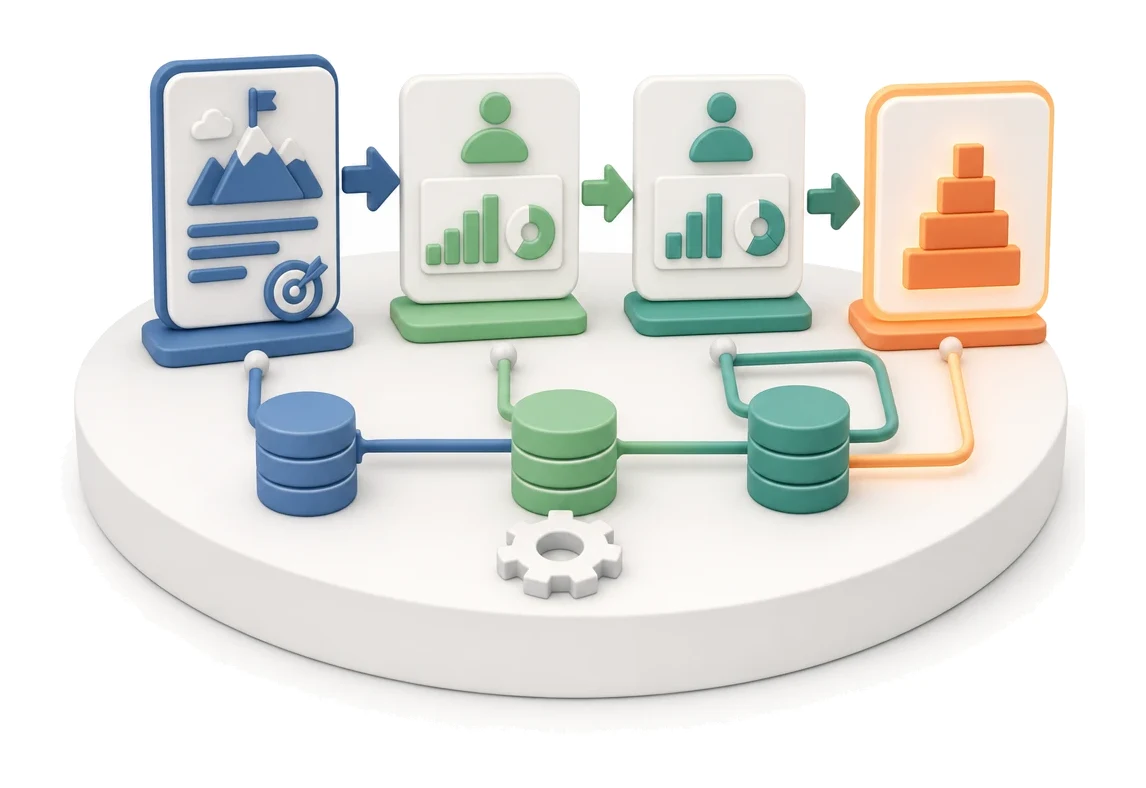
- Input
- Strategic goals
- Flow
- Management goal → department KPI → workstation KPI
- Output
- KPI cascade down to workstation level
What changes in the company after the rollout
A management goal flows down to a department and then to the team leader’s KPI. Everyone understands what their work really impacts.
Full transparency of goals
Every employee sees how their daily tasks translate into the company’s strategic results.
Faster problem detection
A graphical status legend lets you instantly spot KPIs that are below target or close to it.
Better understanding of dependencies
A visualised network of links shows teams which operational levers truly drive key result KPIs.
Structured data hierarchy
The three-level cascade brings order by separating management goals from KPIs of individual business units.
Managers’ time savings
Easy access to definitions, data sources and time series in a single window removes the need to hunt for information across multiple systems.
How this process looks in Process App
Zrzuty pochodzą z działającego systemu — kliknij, aby powiększyć.
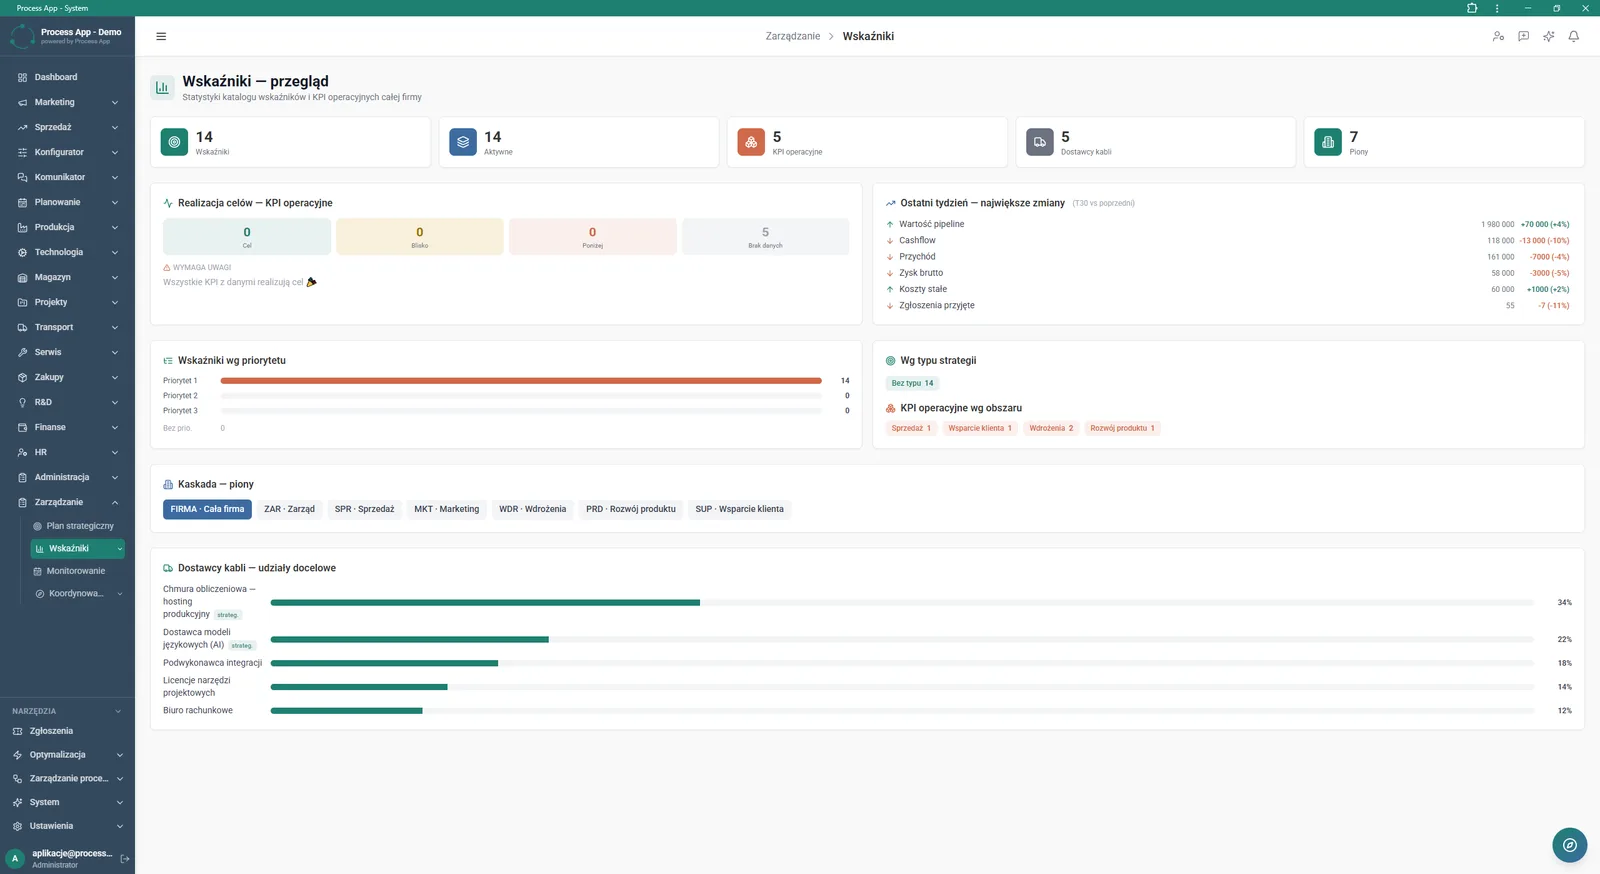
The Indicators – overview screen presents statistics for the company-wide indicator and operational KPI catalogue, including goal achievement, the biggest changes in the last week, and a breakdown of KPIs by priority, strategy and area.
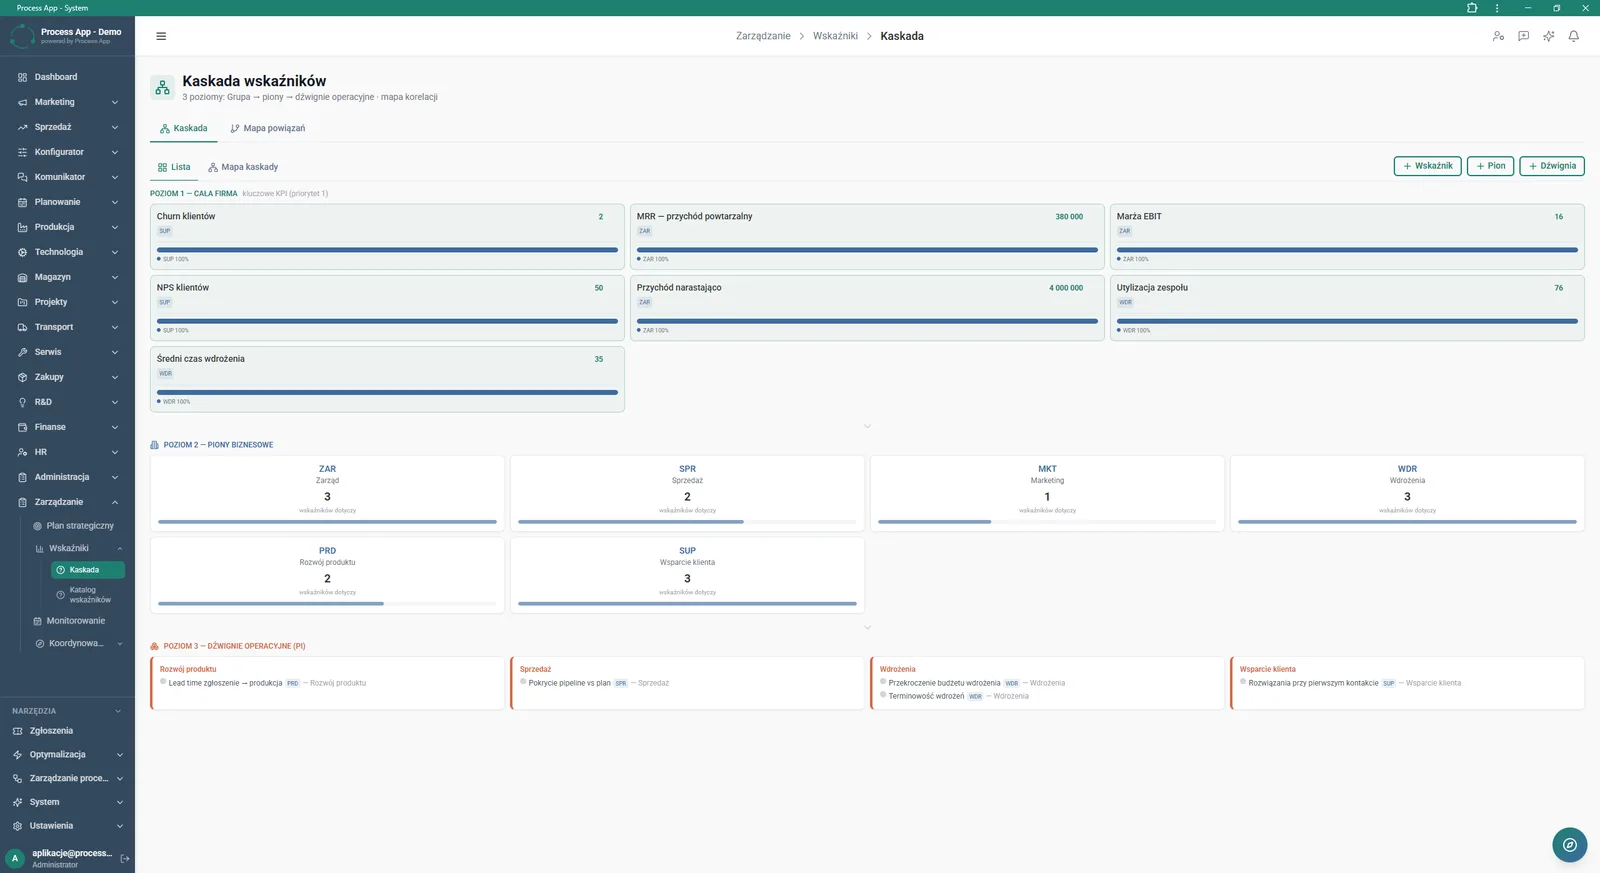
The KPI Cascade screen in list view shows the three-level goal structure: company-wide key KPIs, KPIs assigned to business units, and operational levers.
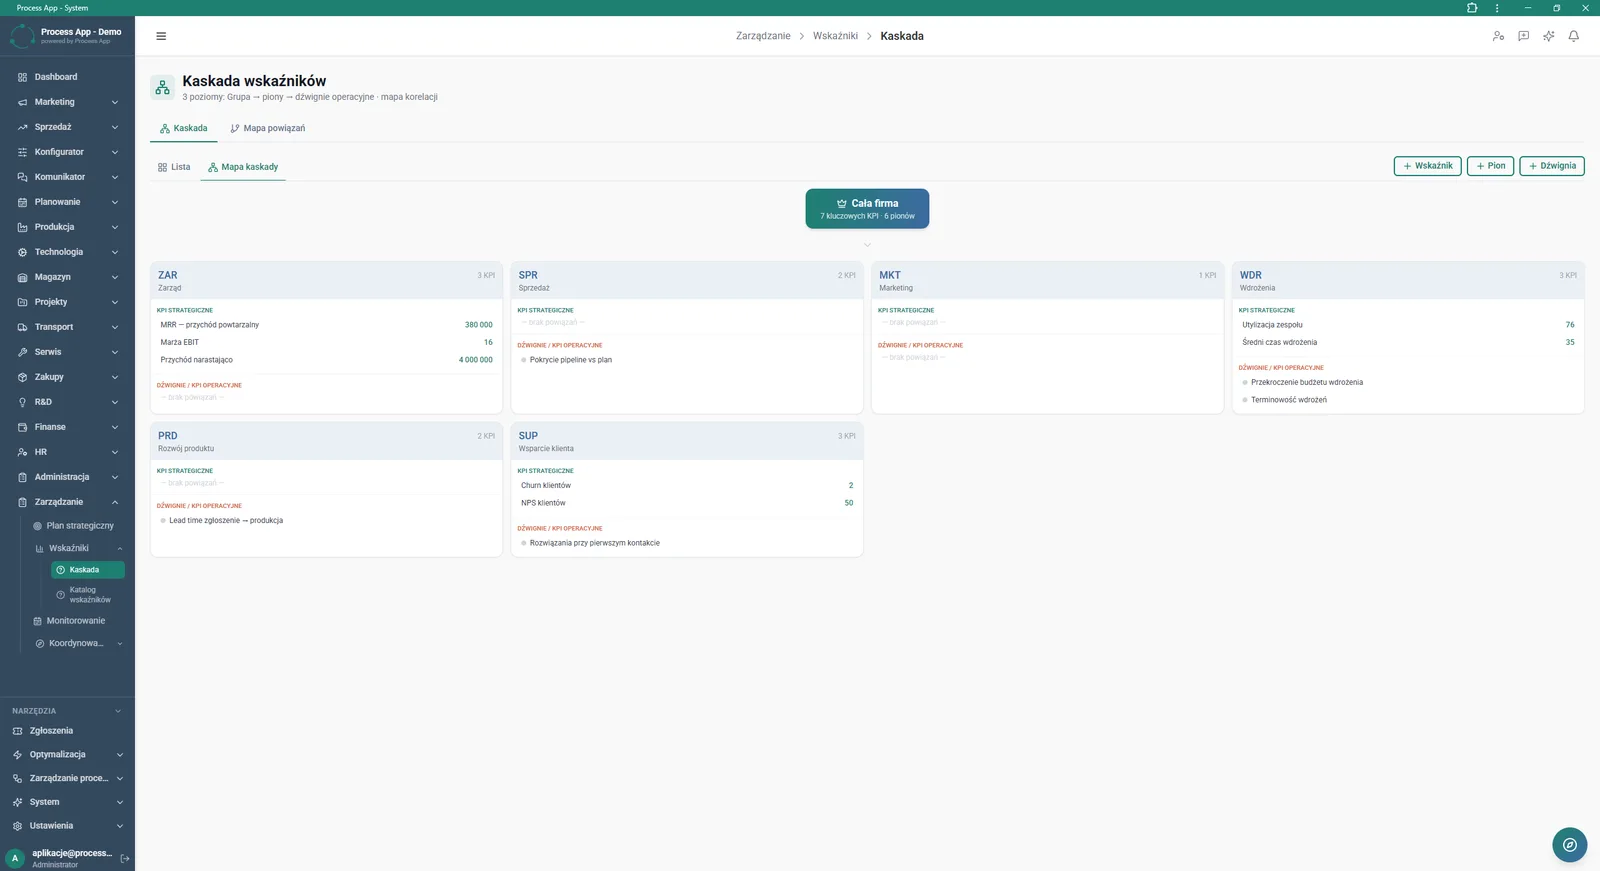
The KPI Cascade screen in cascade map view presents a graphical structure linking company-wide goals with individual business units, their strategic KPIs and operational levers.
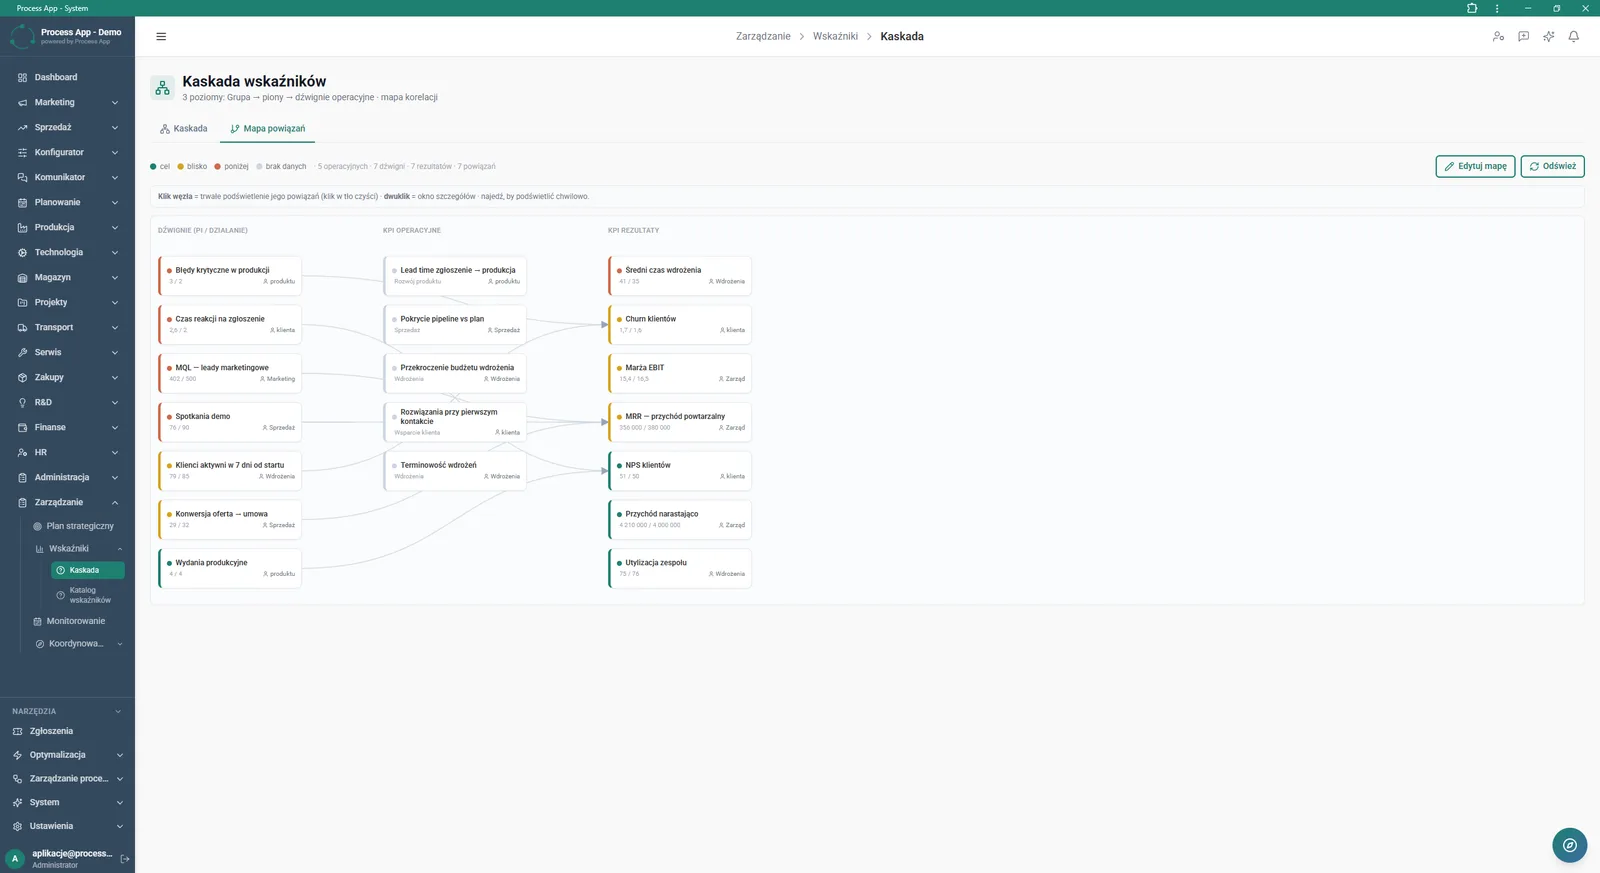
The KPI Cascade screen in the Links map tab presents a graphical network of dependencies between levers, operational KPIs and result KPIs.
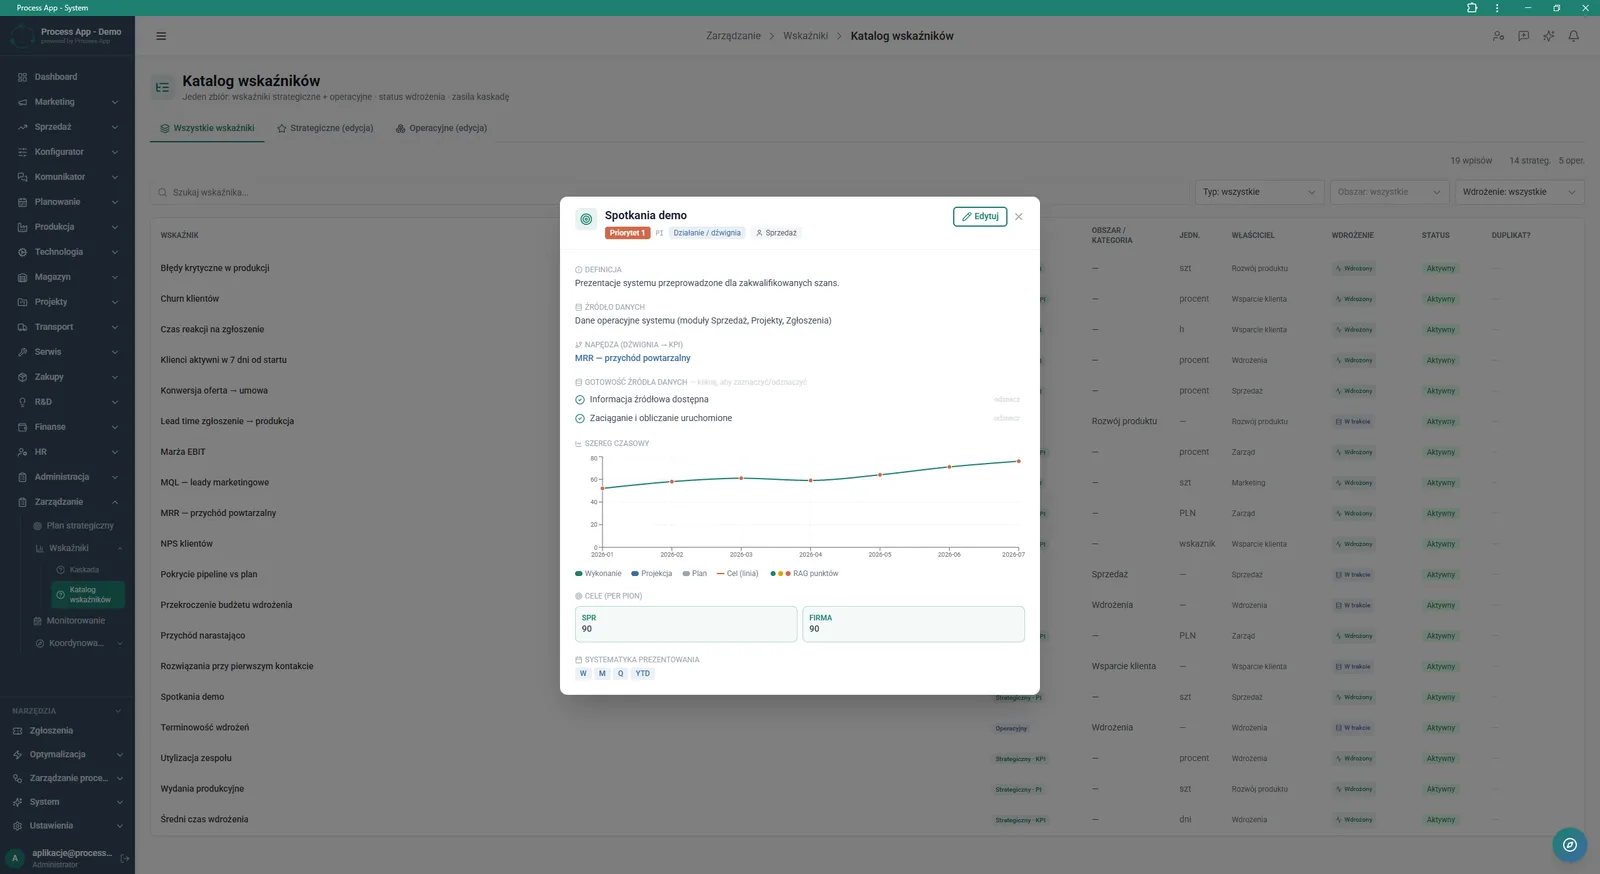
The Indicator catalogue screen with an open details window for a selected KPI, showing its definition, data source, links, time series chart and assigned targets.
What exactly you get
Three-level KPI cascade
The system presents goals split into company-wide KPIs, business unit KPIs and operational levers, in either list or map view.
Interactive dependency map
The application generates a graphical network of dependencies between levers and KPIs, with node highlighting on click or hover.
Statistics and change overview
The overview screen shows goal achievement, breakdown by priority and the biggest KPI changes in the last week.
KPI details window
The module allows you to edit definitions, verify data source readiness, and analyse charts with actuals, plan and projection.
Filtering and search
The catalogue enables fast KPI lookup by type, area, implementation status and keywords.
What AI does for you in this process
KPI variance analysis
Artificial intelligence analyses the largest changes in the last week, making it easier to detect data anomalies.
Results projection generation
Artificial intelligence analyses historical performance and supports calculating projections on time series charts.
Operational dependency mapping
Artificial intelligence analyses relationships between nodes, helping identify levers with the greatest impact on result KPIs.
The process from start to finish
Build a transparent goal structure using a three-level cascade, from company-wide key KPIs, through business units, down to operational levers. Monitor goal achievement in the Indicators – overview screen, where you can quickly check statuses and the largest changes from the last week. Switch between a list view and a graphical cascade map to better understand the relationship structure in your organisation. Analyse the network of dependencies between levers, operational KPIs and result KPIs in the Links map tab. Manage definitions, data sources and assigned targets in the details window directly from the Indicator catalogue screen. Change how data is presented on time series charts by choosing weekly, monthly, quarterly or year-to-date views. This way every employee knows exactly what their work really influences.
See this process on your own data
We will walk you through the “Cascading Goals and KPIs” module using your company as the example — the input, the flow and the end result in Process App.
Explore the remaining system modules
Strategic Planning (JPS)
KPI Monitoring
Operational Meeting Management
Lead Generation
Prospecting
Cold Mailing
Cold Calling
Sales Opportunity Management
Quotation Preparation
Offer Preparation and Sending
Product Configuration
BOM Development
Strategic Planning (JPS)
KPI Monitoring
Operational Meeting Management
Lead Generation
Prospecting
Cold Mailing
Cold Calling
Sales Opportunity Management
Quotation Preparation
Offer Preparation and Sending
Product Configuration
