KPI Monitoring
Do you waste time manually collecting data for reports from different departments? The Monitoring module automatically aggregates operational and financial KPIs and presents them in real time on clear dashboards. Artificial intelligence continuously analyses this data, generating ready-to-use management commentary and highlighting process gaps.
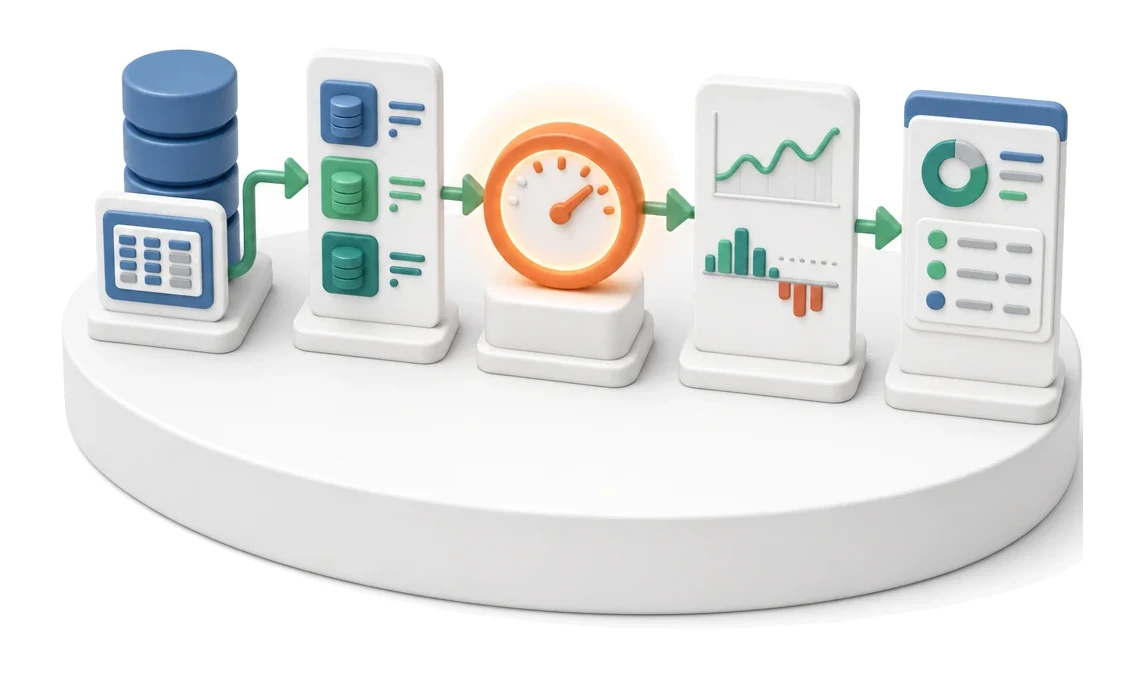
- Input
- System operational data
- Flow
- Data from modules → KPI reading → trend and deviation
- Output
- Current KPI readings
What changes in the company after the rollout
KPIs are fed with data from operational modules, without manual reporting. Readings are available at any time.
No manual reporting
The system automatically pulls data from operational modules, eliminating errors and saving the team’s time.
Fast issue identification
The ability to filter out only problematic KPIs enables immediate management response.
Full trend visibility
Switching between table and charts makes it easier to understand long-term changes in the company.
Clear view of organisational structure
Cascading division by business unit allows you to assess the performance of each department individually.
Always up-to-date data
KPI readings are available at any time, significantly speeding up the decision-making process.
How this process looks in Process App
Zrzuty pochodzą z działającego systemu — kliknij, aby powiększyć.
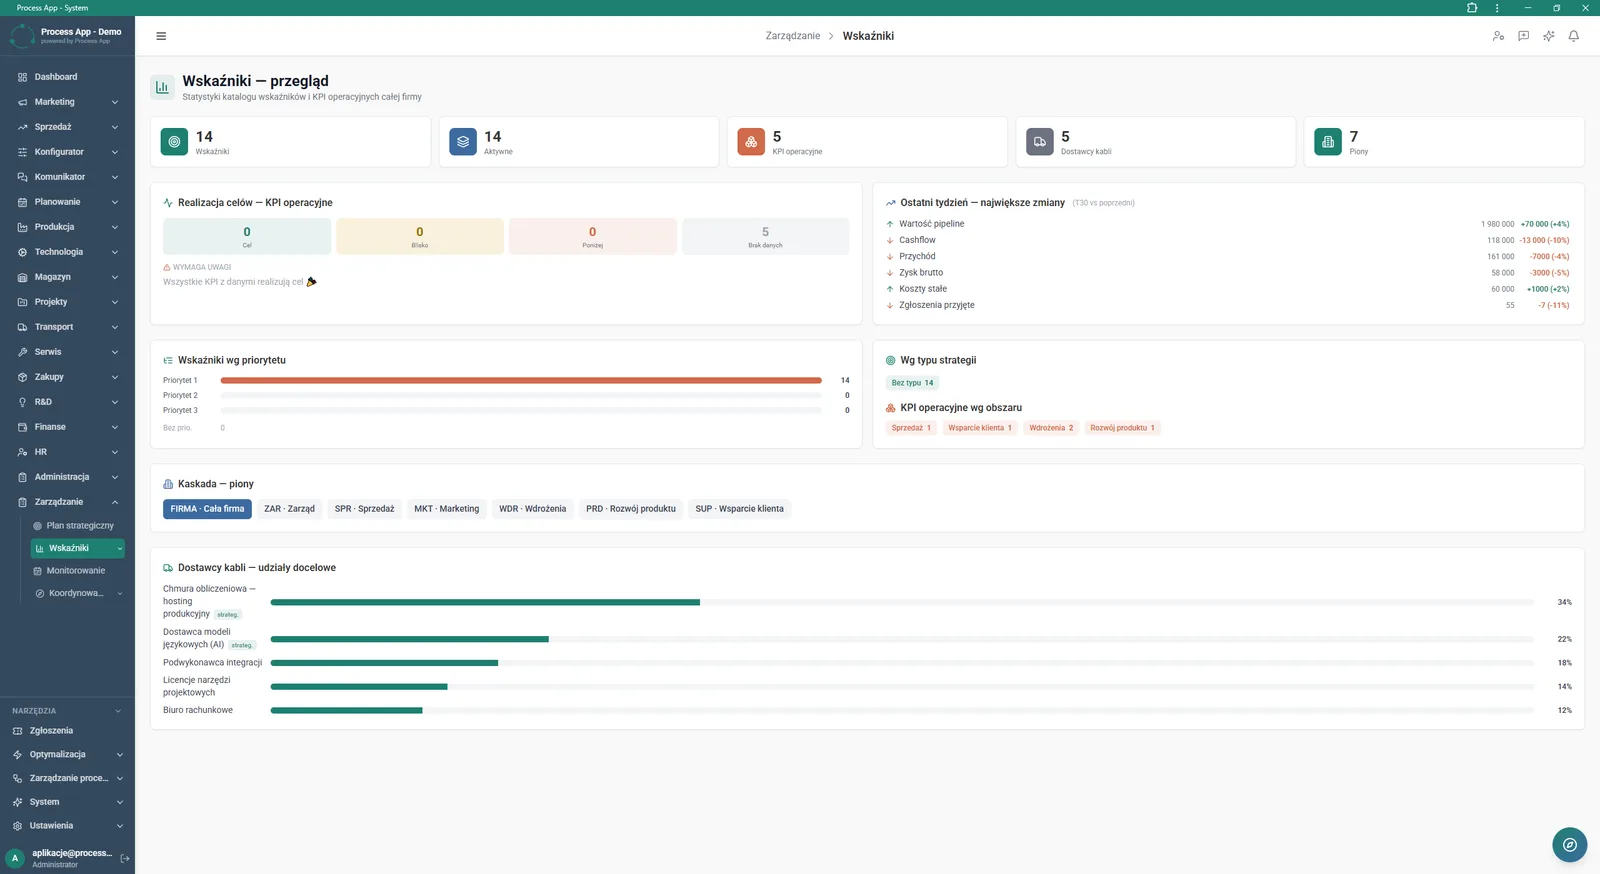
Indicator overview screen showing statistics of the KPI catalogue and operational KPIs as numeric tiles, goal achievement charts, and breakdowns of changes and priorities.
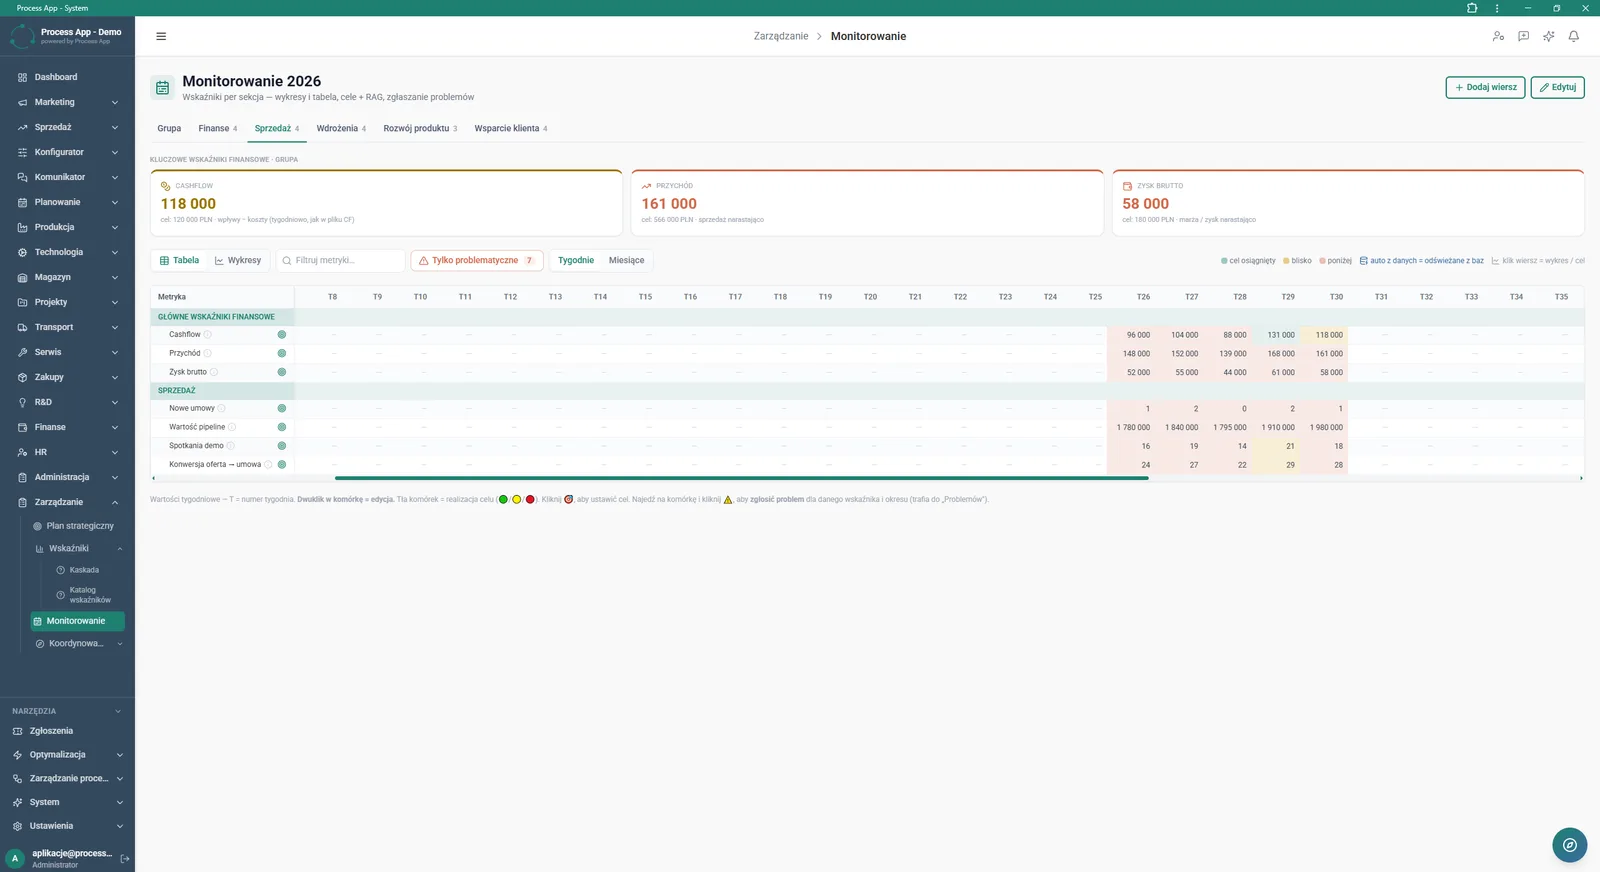
Monitoring 2026 screen showing a tabular weekly KPI summary and tiles aggregating key metrics for the selected group.
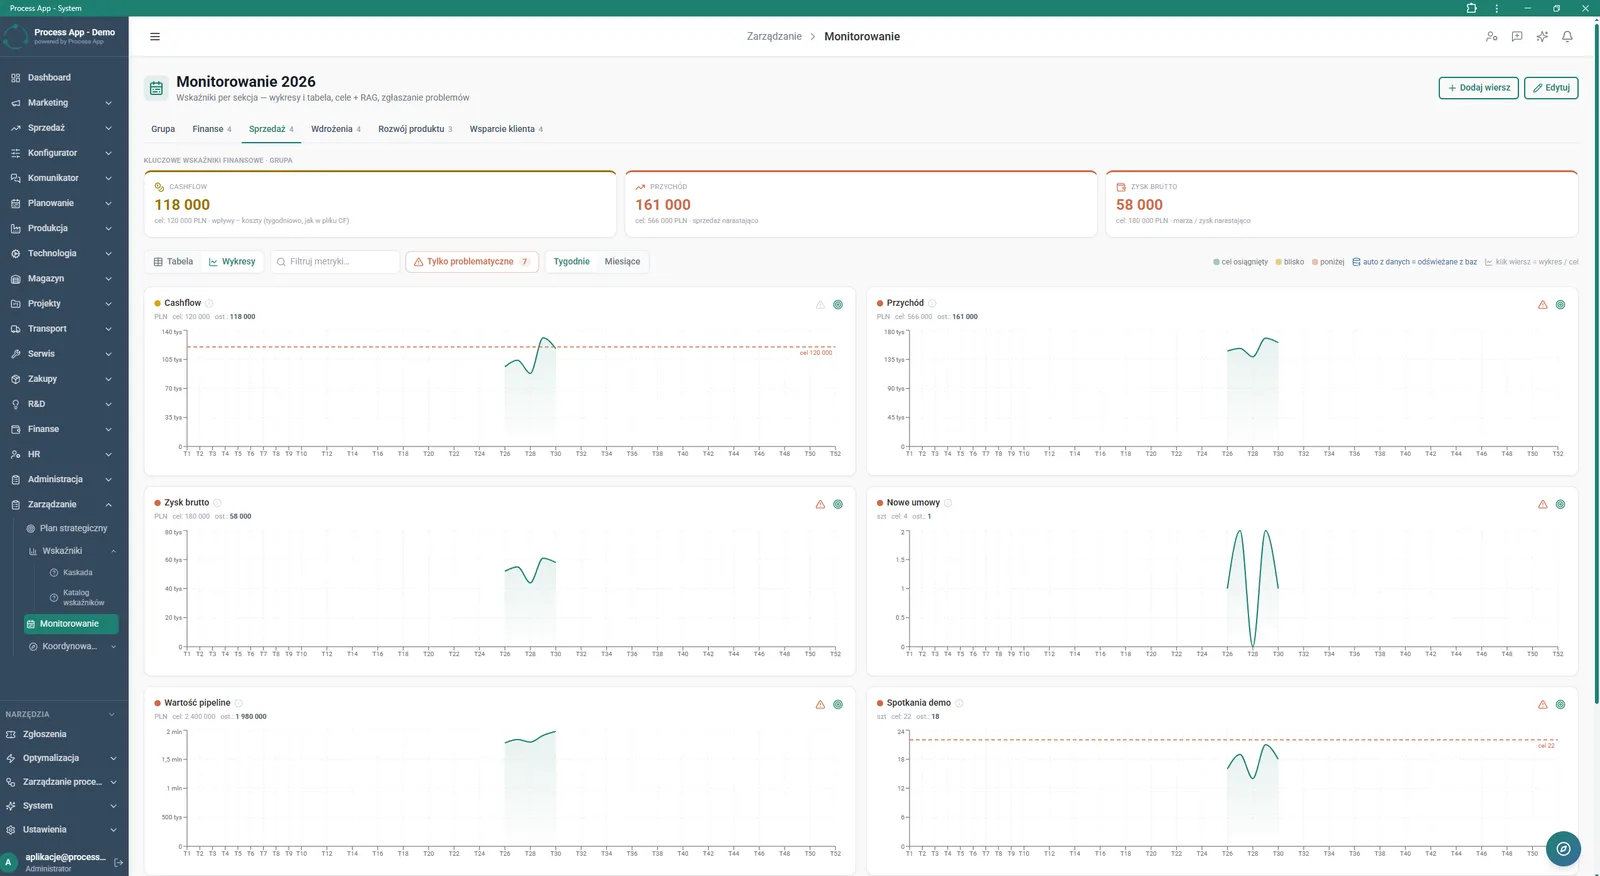
Monitoring 2026 screen in chart view, showing tiles with key KPIs and a series of weekly line charts for selected metrics.
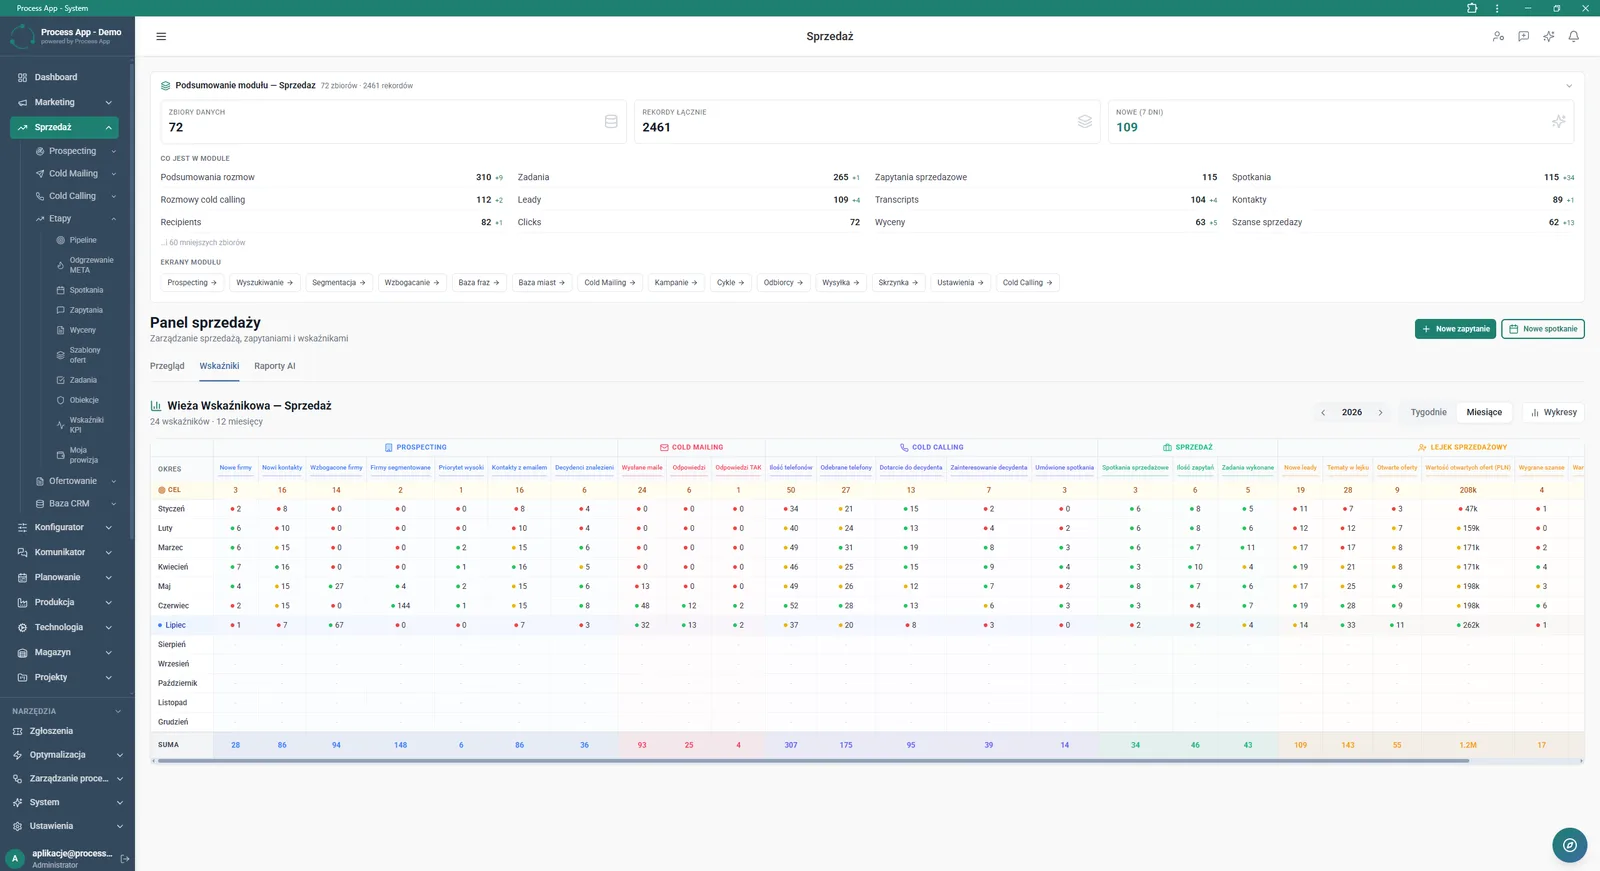
Sales Panel screen in KPI view, showing a module summary and the Indicator Tower table with monthly data for each process stage.
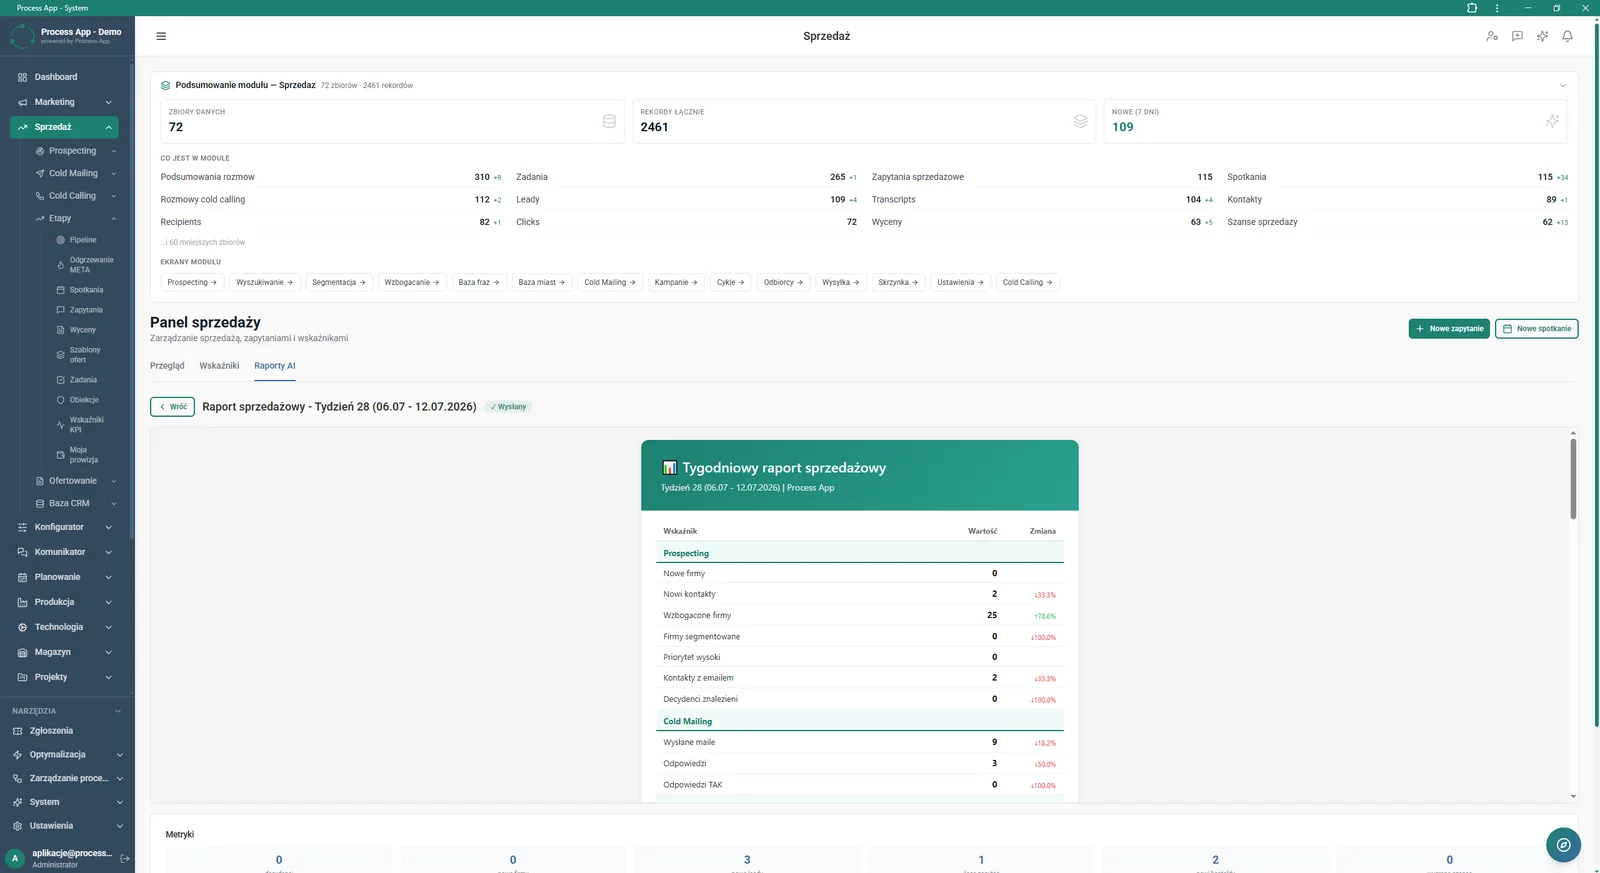
Sales Panel screen in AI Reports view, showing an overall summary of the Sales module and a detailed, generated weekly sales report with KPI values and changes.
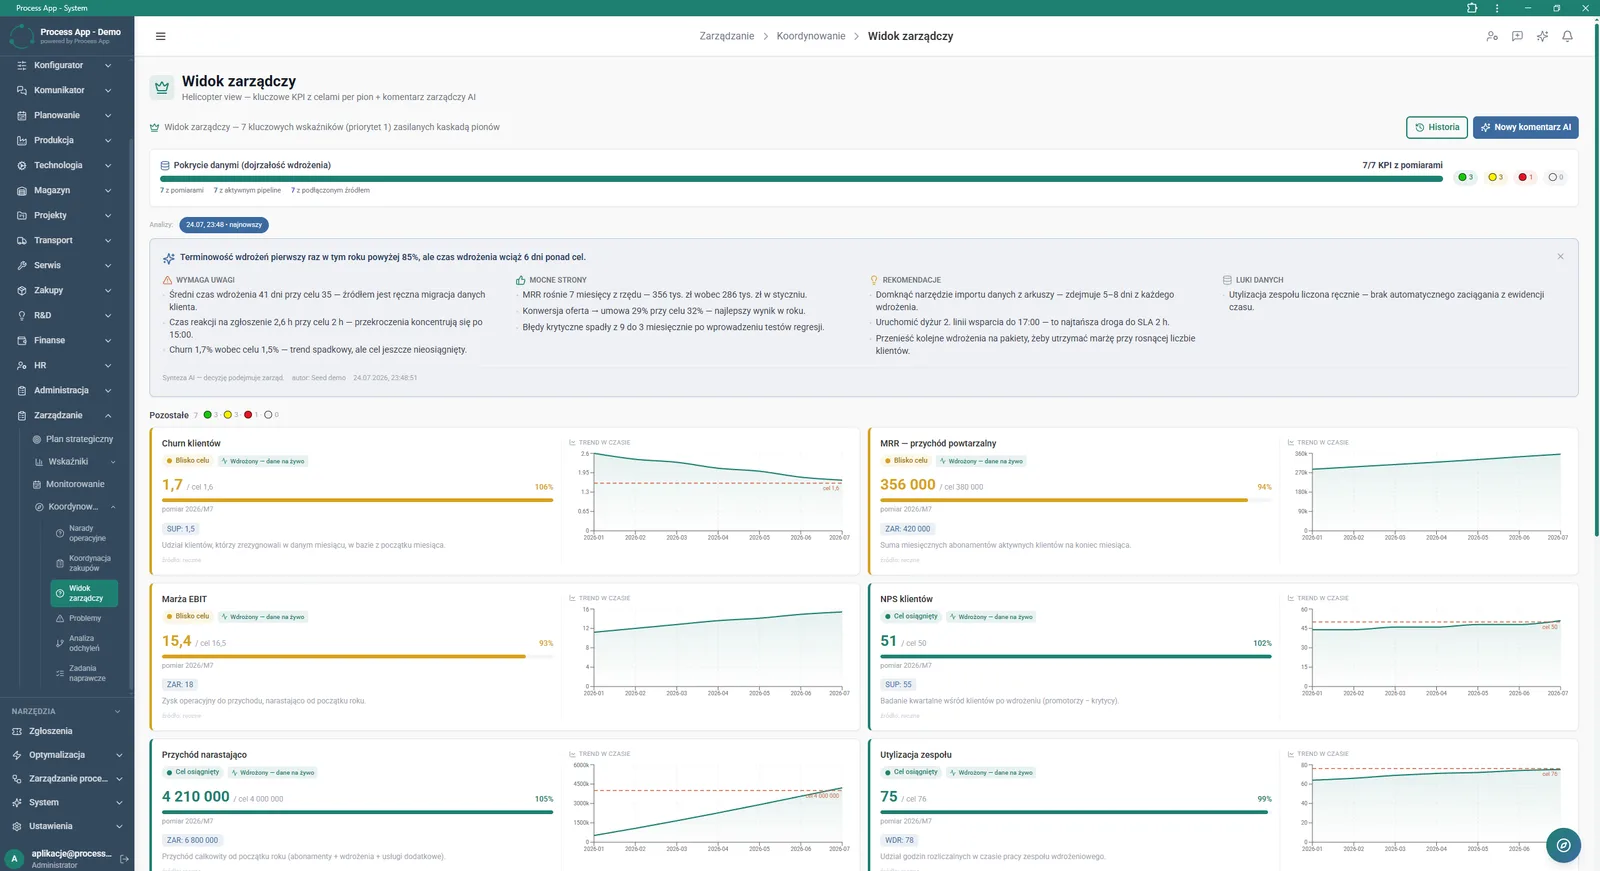
Management View screen showing a summary of key KPIs as tiles with trend charts, plus an AI-generated management commentary broken down into strengths, recommendations and data gaps.
What exactly you get
Management view
Presents key KPI indicators as tiles with trend charts and goal achievement status.
Indicator Tower
Aggregates monthly data for each process stage in a clear table.
Filtering and interval changes
Enables searching for metrics and changing time aggregation to weeks or months.
View switching
Allows smooth switching between a table view and a series of line charts.
KPI categorisation
Groups metrics by priority, strategy type and operational area.
What AI does for you in this process
Generation of management commentary
Artificial intelligence creates a synthesis of the situation broken down into strengths, recommendations and data gaps.
Creation of sales reports
AI generates a detailed weekly report with KPI values and changes.
Implementation maturity assessment
AI algorithms analyse data coverage and indicate areas that require management attention.
The process from start to finish
Control the health of the entire company in one place, without waiting for month-end. Review key operational KPIs broken down by divisions such as Sales, Implementations or Product Development. Track goal attainment and instantly spot the biggest changes from the last week. Analyse trends on line charts or drill into detailed data in a tabular view by week and month. Filter metrics to focus only on problematic ones that require your immediate attention. Use the Indicator Tower for in-depth analysis of each stage of the sales funnel. Make the right decisions based on always up-to-date readings that the system pulls directly from operational modules.
See this process on your own data
We will walk you through the “KPI Monitoring” module using your company as the example — the input, the flow and the end result in Process App.
Explore the remaining system modules
Strategic Planning (JPS)
Cascading Goals and KPIs
Operational Meeting Management
Lead Generation
Prospecting
Cold Mailing
Cold Calling
Sales Opportunity Management
Quotation Preparation
Offer Preparation and Sending
Product Configuration
BOM Development
Strategic Planning (JPS)
Cascading Goals and KPIs
Operational Meeting Management
Lead Generation
Prospecting
Cold Mailing
Cold Calling
Sales Opportunity Management
Quotation Preparation
Offer Preparation and Sending
Product Configuration
