Demand vs Inventory Balancing
Missing materials at a critical production moment while the warehouse is overflowing with unnecessary stock? The Warehouse module matches the production plan with current inventory and BOM recipes, generating an accurate shortage list for purchasing. Built-in AI algorithms automatically calculate minimum stock levels based on historical movements and demand.
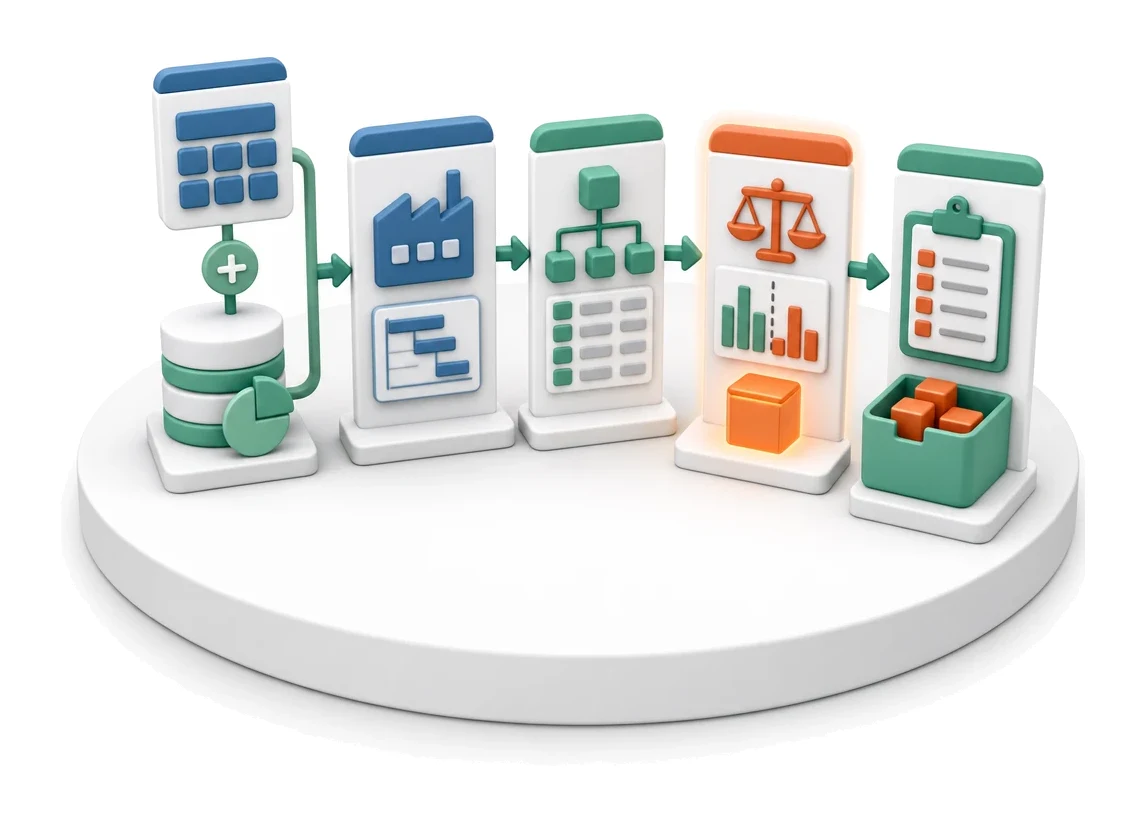
- Input
- Production plan + stock levels
- Flow
- Production plan → BOM explosion → balance and shortages for purchasing
- Output
- Shortage list for purchasing
What changes in the company after the rollout
The system compares the production plan with stock levels and open inbound orders. The result is a shortage list for purchasing.
Full inventory visibility
You gain instant insight into stock levels of raw materials, semi-finished products, and finished goods.
Smooth production processes
You eliminate downtime thanks to precise matching of material demand with current stock levels.
Optimised storage costs
You avoid excessive capital lock-up through ongoing analysis of inventory value and items below minimum levels.
Fast error identification
You easily find discrepancies thanks to the complete history of warehouse movements and adjustments.
Well-structured product hierarchy
You ensure consistent production using clear recipes assigned to specific models.
How this process looks in Process App
Zrzuty pochodzą z działającego systemu — kliknij, aby powiększyć.
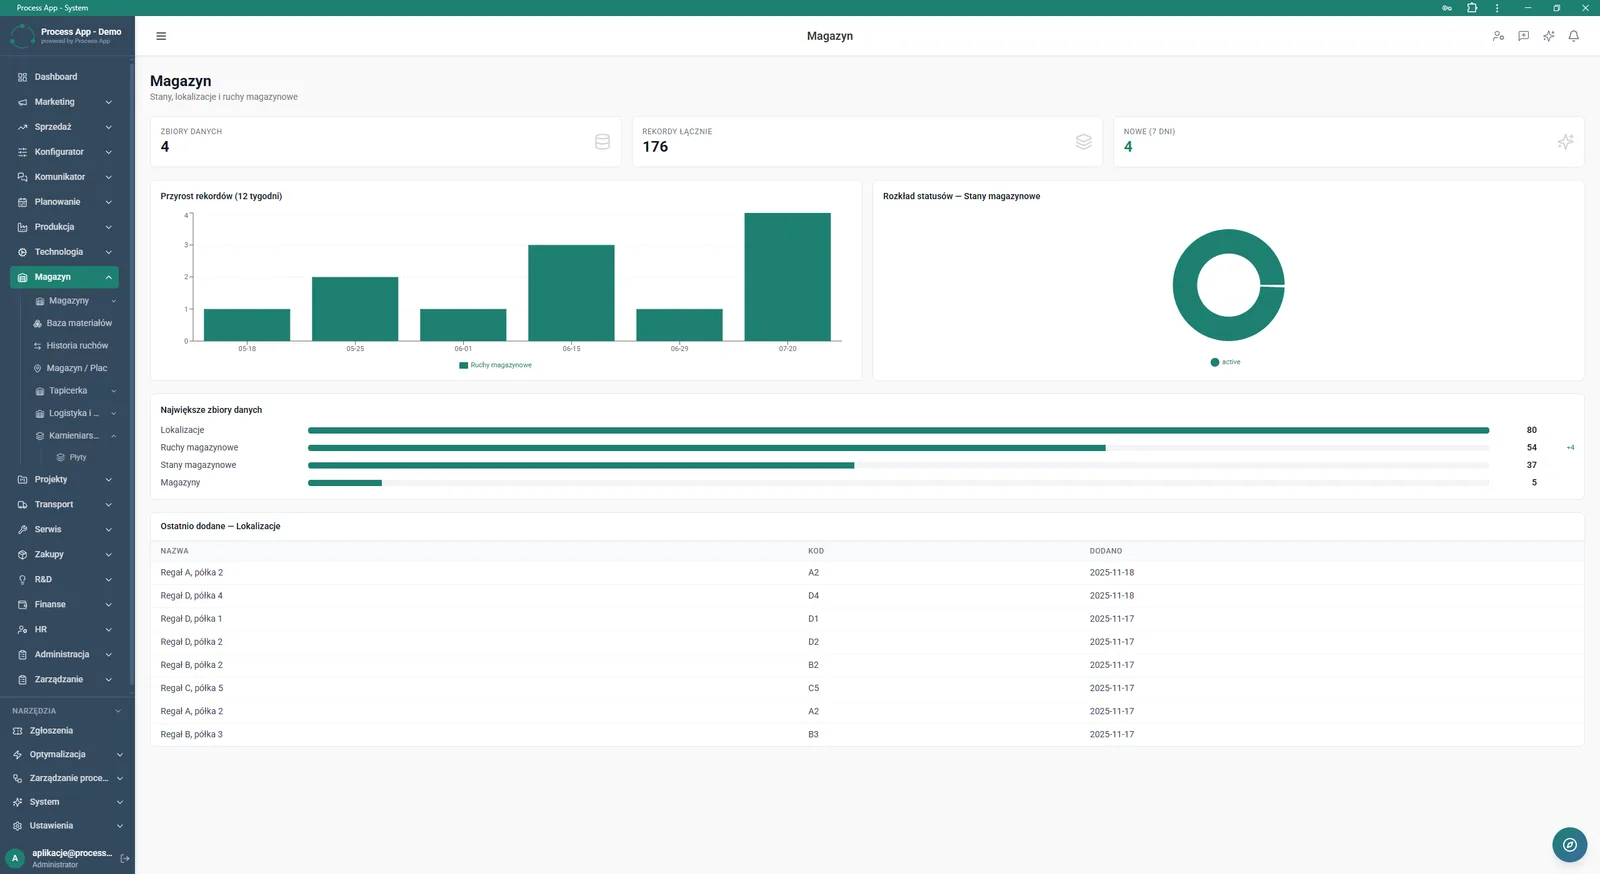
Main Warehouse module screen showing a data summary as tiles with statistics, growth and status charts, and a table with recently added locations.
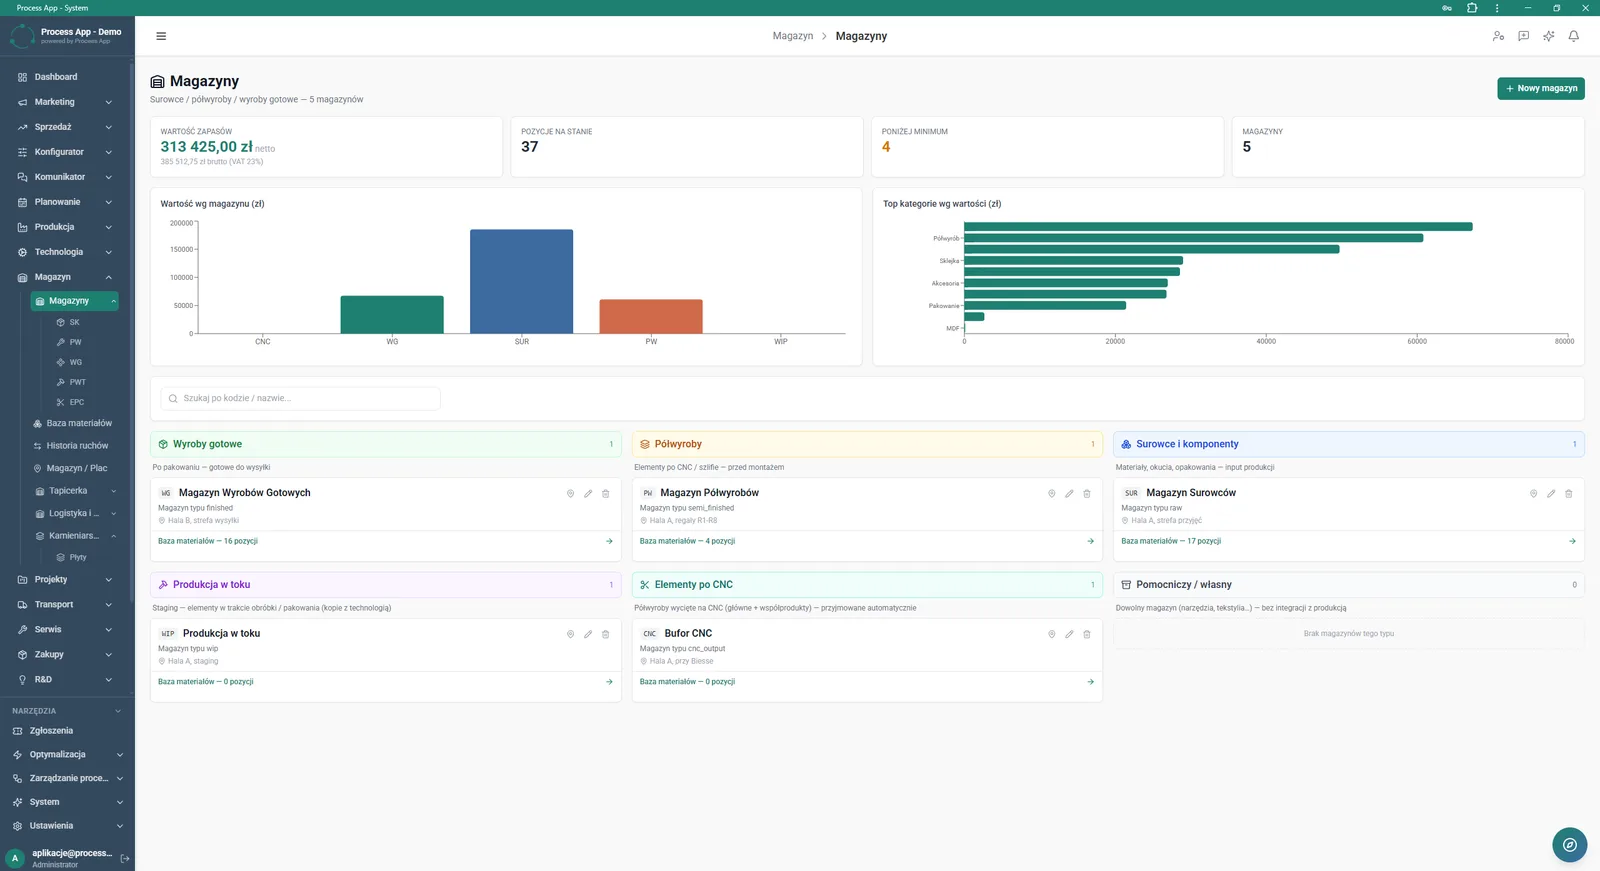
Warehouses screen showing tiles summarising inventory value and quantities, value charts, and a grouped list of defined warehouses.
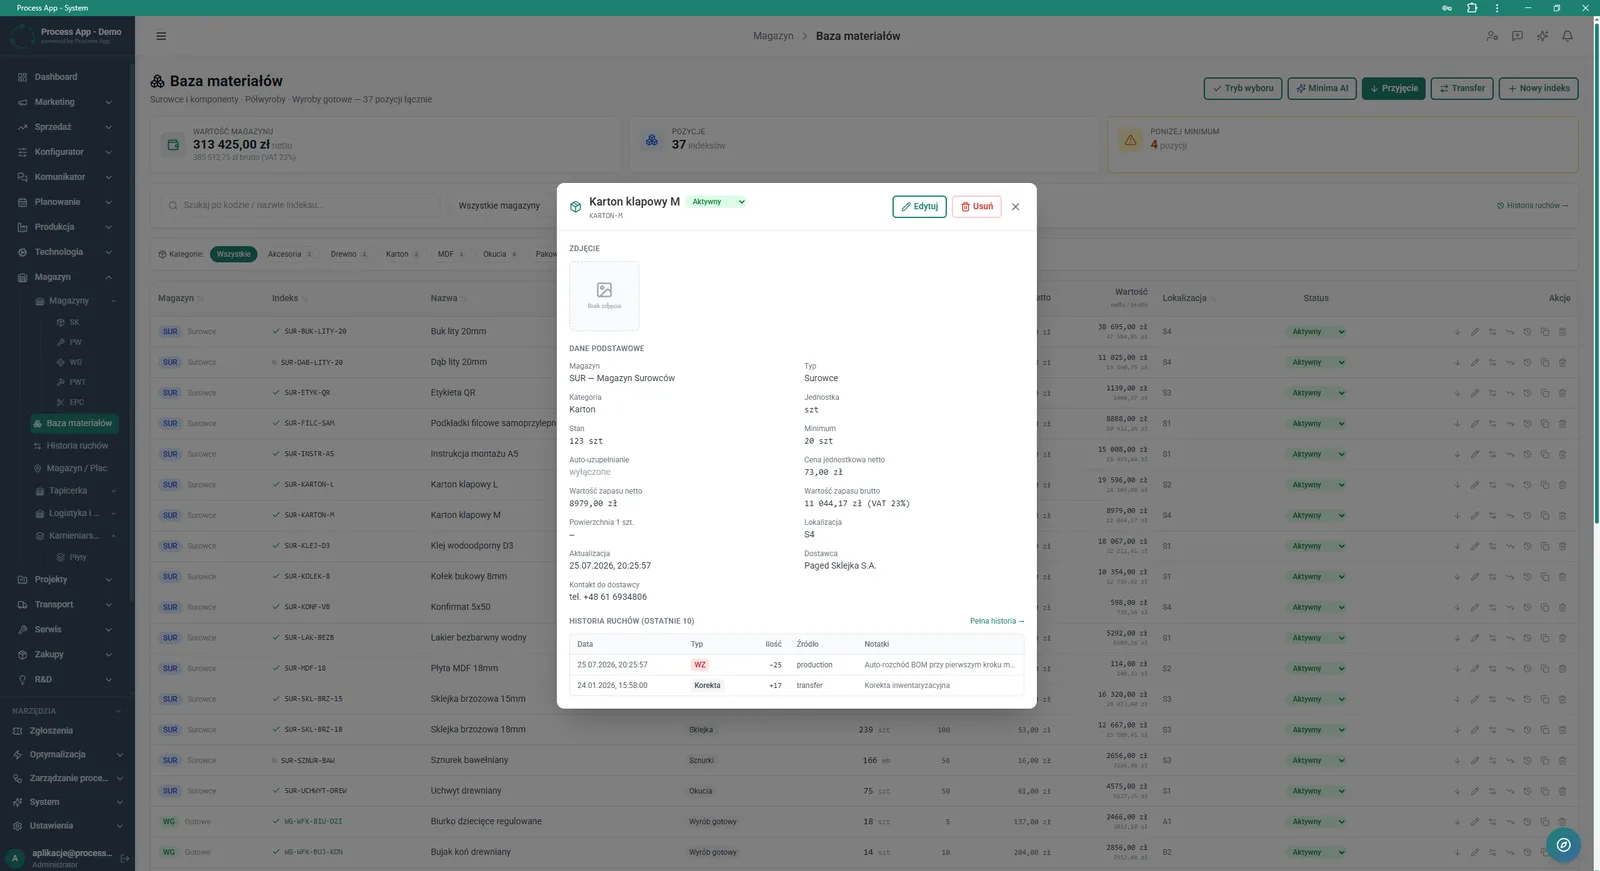
Material database screen with an open detail window for a specific item, showing master data, stock levels, and movement history.
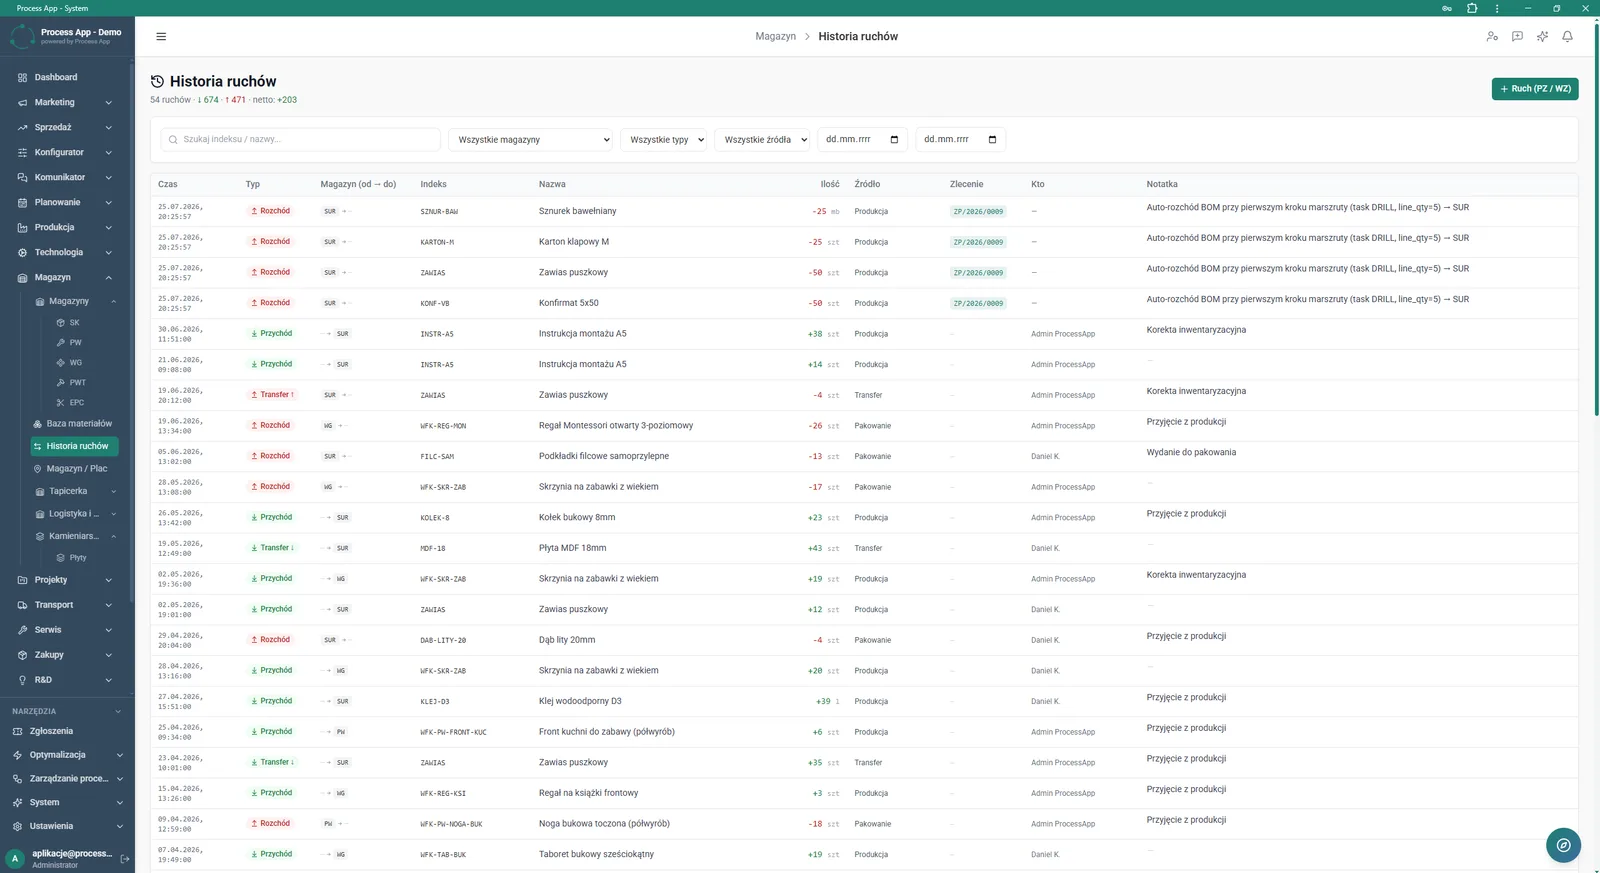
Movement history screen presenting a tabular list of all warehouse operations with search filters and quantity summaries.
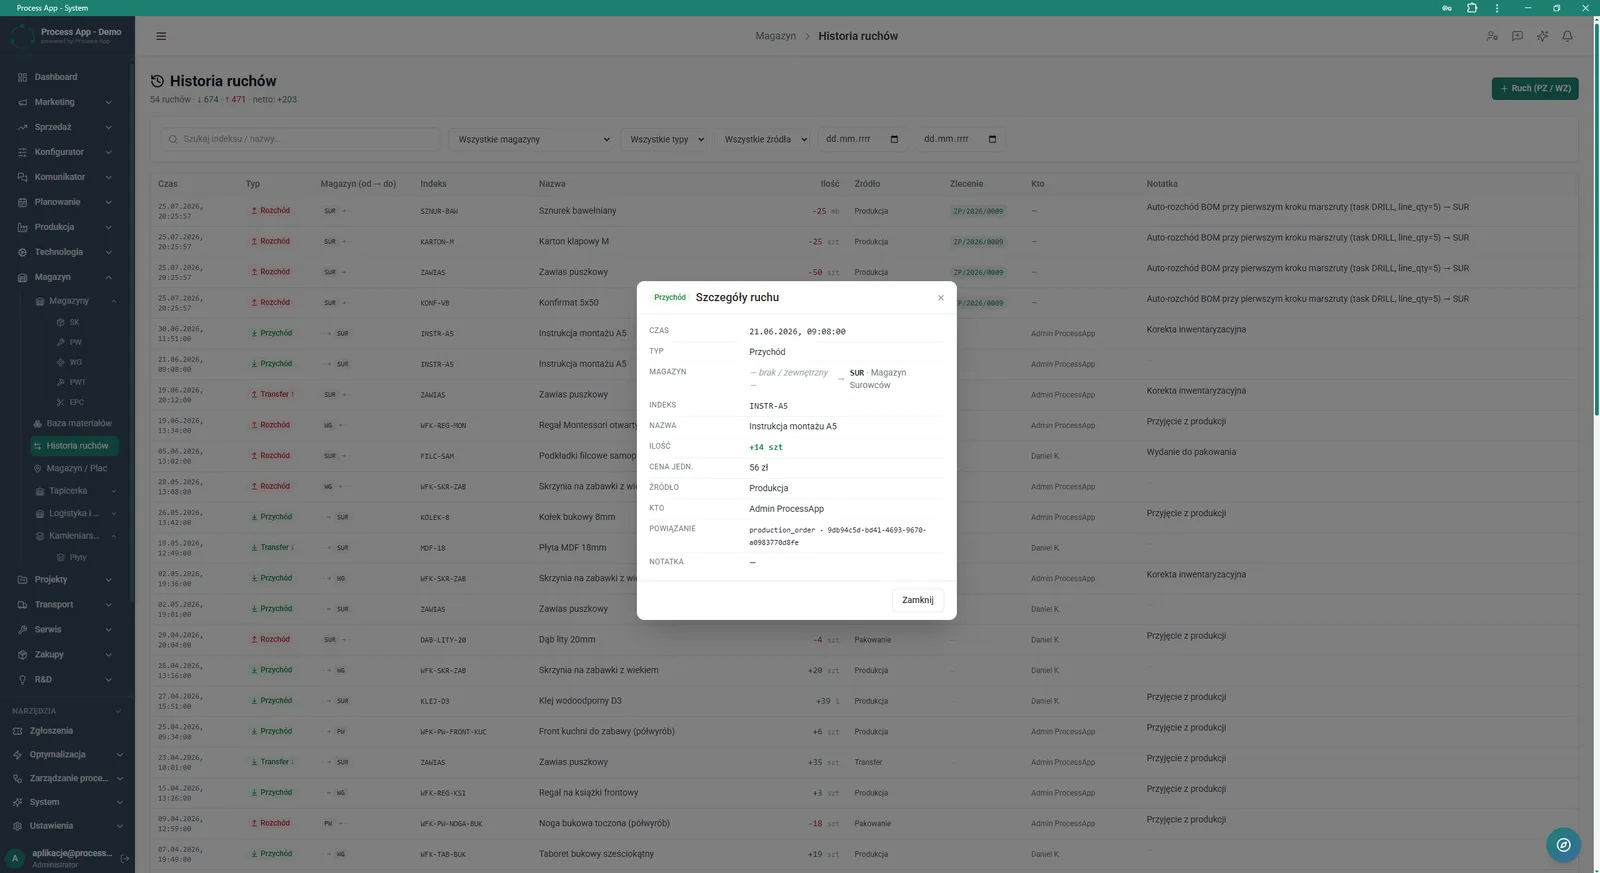
Movement history screen with the Movement details modal window open, showing detailed information on a selected Incoming operation.
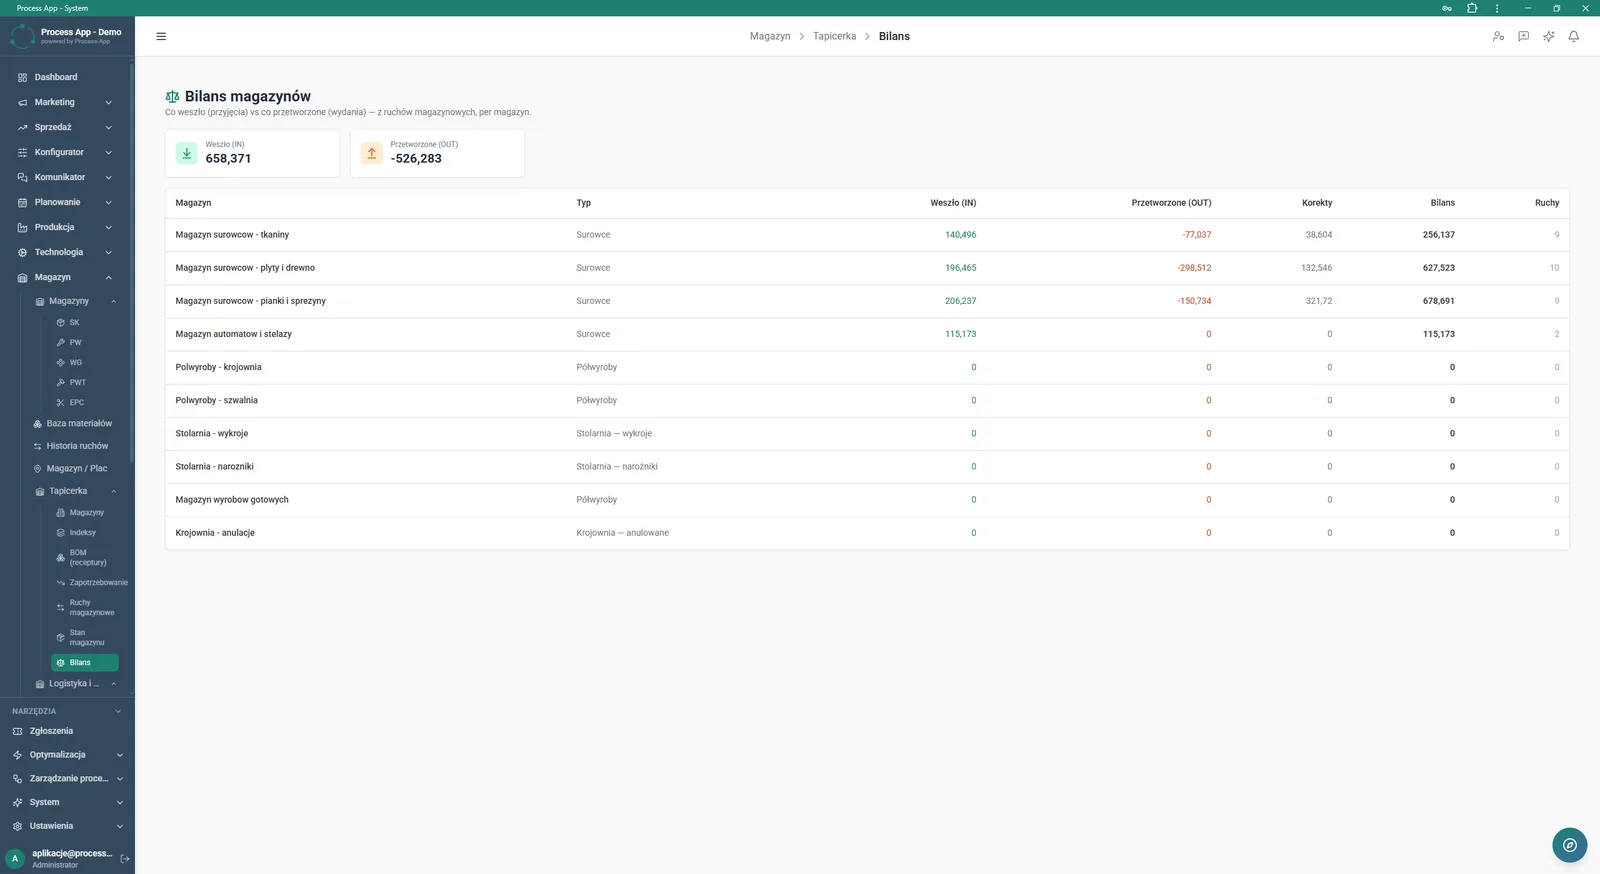
Warehouse balance screen presenting a tabular summary of receipts, issues, adjustments, and balance for each warehouse, with an overall quantity summary.
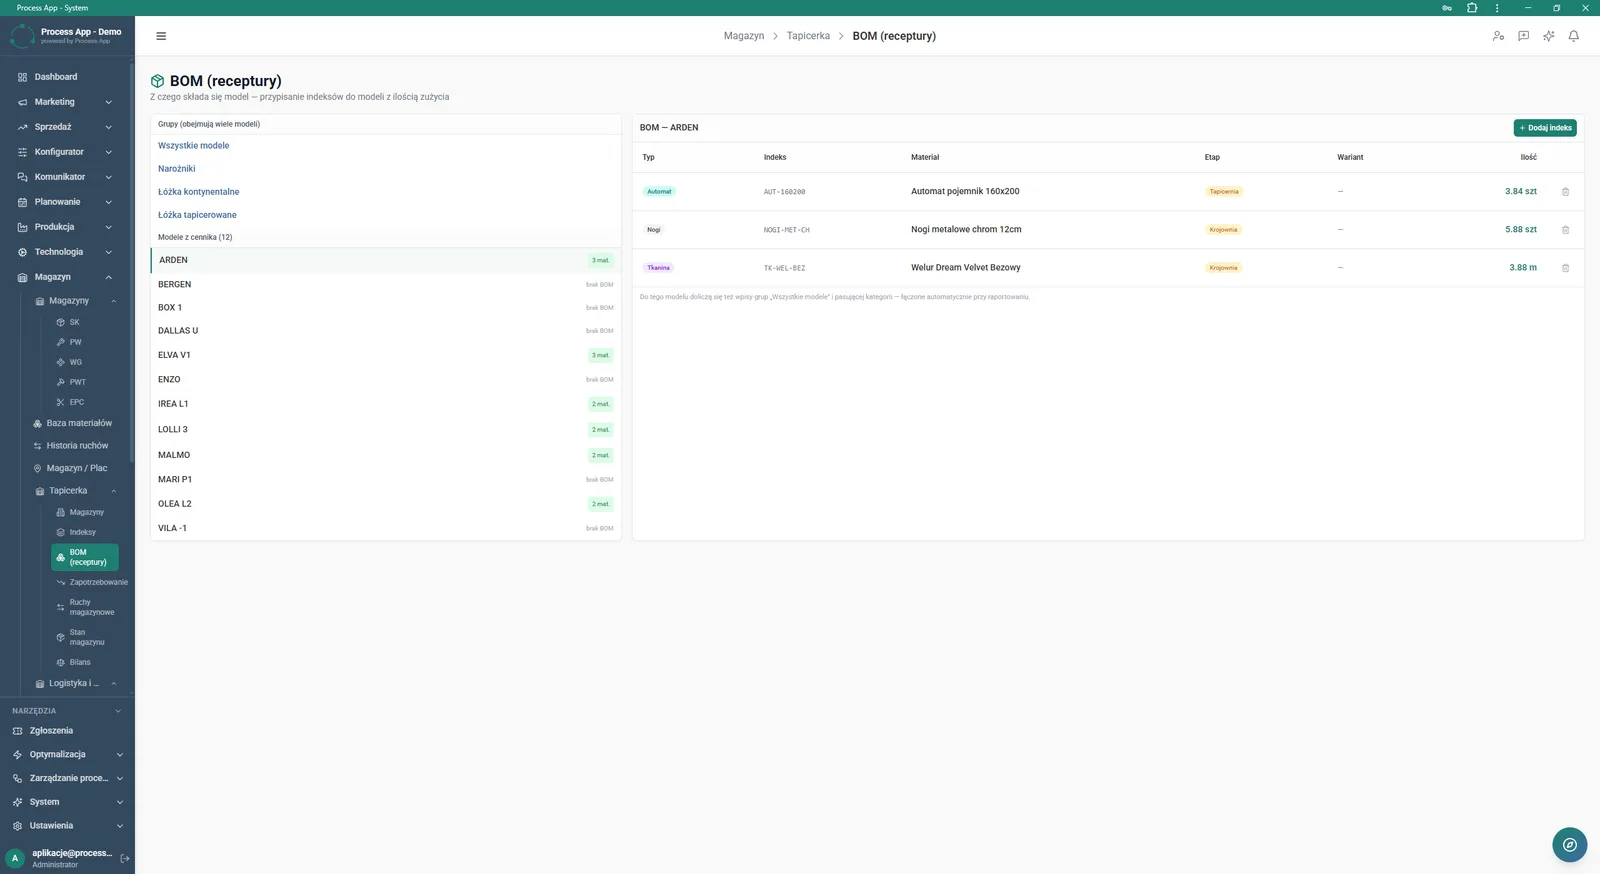
BOM (recipes) screen showing a list of models with recipe status information and a detailed table of components assigned to the selected model.
What exactly you get
Balancing receipts and issues
The system aggregates operations in the Warehouse balance view, showing Entered (IN) and Processed (OUT) columns.
Material master data management
The application allows you to add new item codes, edit master data, and assign suppliers and locations.
Warehouse movement registration
The module enables manual entry of PZ / WZ operations and viewing detailed movement data, including source and links.
BOM recipe management
The system displays a list of models and lets you add or remove components assigned to the selected product.
Data filtering and search
The application offers search by item code or name and filtering of history by warehouse, type, and date.
What AI does for you in this process
Automatic minimum stock calculation
AI analyses historical material consumption to optimally determine inventory levels as part of the Minima AI function.
Auto-replenishment support
AI monitors stock levels and checks items below minimum, supporting the generation of shortage lists for purchasing.
Status distribution analysis
AI categorises data sets and presents status distribution on charts, making it easier to quickly assess warehouse health.
The process from start to finish
Control the full flow of raw materials and finished goods in one place, from receipt to issue to production. Review a detailed Warehouse balance to continuously track what has come in and what has been processed. Manage product structures with the BOM (recipes) view, where you can easily assign the right item codes and quantities to specific models. Analyze Movement history using advanced filters to quickly trace the source of each warehouse operation. Verify the value of your inventory by category and specific locations, avoiding tying up unnecessary cash. Add new items to the Material database and assign suppliers to speed up the purchasing process.
See this process on your own data
We will walk you through the “Demand vs Inventory Balancing” module using your company as the example — the input, the flow and the end result in Process App.
Explore the remaining system modules

Lead Generation
Prospecting
Cold Mailing
Cold Calling
Sales Opportunity Management
Quotation Preparation
Offer Preparation and Sending
Product Configuration
BOM Development
Technology Routing
Manufacturing Cost Calculation
Demand Forecasting (Forecast)
Lead Generation
Prospecting
Cold Mailing
Cold Calling
Sales Opportunity Management
Quotation Preparation
Offer Preparation and Sending
Product Configuration
BOM Development
Technology Routing
Manufacturing Cost Calculation
