Demand Forecasting (Forecast)
Wondering if your production will be fully loaded in the coming months? The Forecast module combines sales pipeline data with order history to build an accurate forecast of resource demand. Artificial intelligence assesses sales opportunities and automatically suggests the optimal distribution of orders over time, preventing scheduling conflicts.
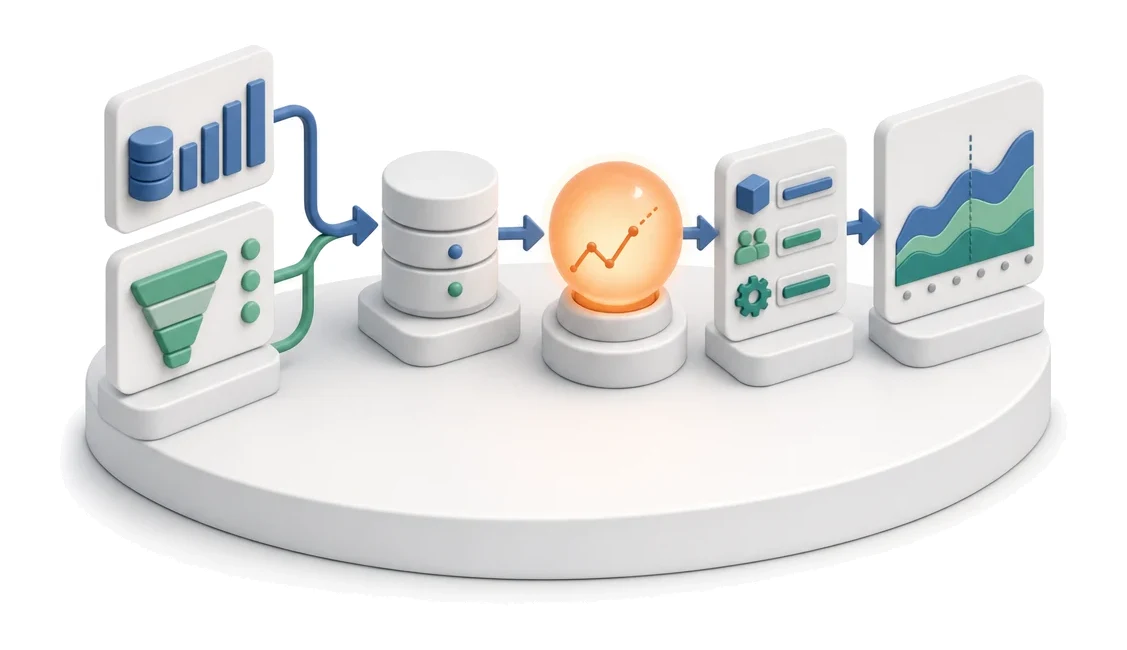
- Input
- Sales history + sales pipeline
- Flow
- Historical data and pipeline → forecast → resource decisions
- Output
- Time-phased workload forecast
What changes in the company after the rollout
Sales history and the pipeline provide a forecast of workload for the coming weeks. The company knows in advance whether it will have enough work.
Visibility of production workload
You know well in advance whether the company will have enough work in the coming months.
Seamless handover from sales
You link data from the CRM funnel directly to the production plan without retyping information by hand.
Optimal use of resources
You avoid downtime and overloads thanks to ongoing control of available man-hours in each crew.
Fast response to delays
You quickly identify orders with missing stages and prevent new bottlenecks from forming.
Full control over the order
You track every stage in the product lifecycle, from the first quote to final transport to the customer.
How this process looks in Process App
Zrzuty pochodzą z działającego systemu — kliknij, aby powiększyć.
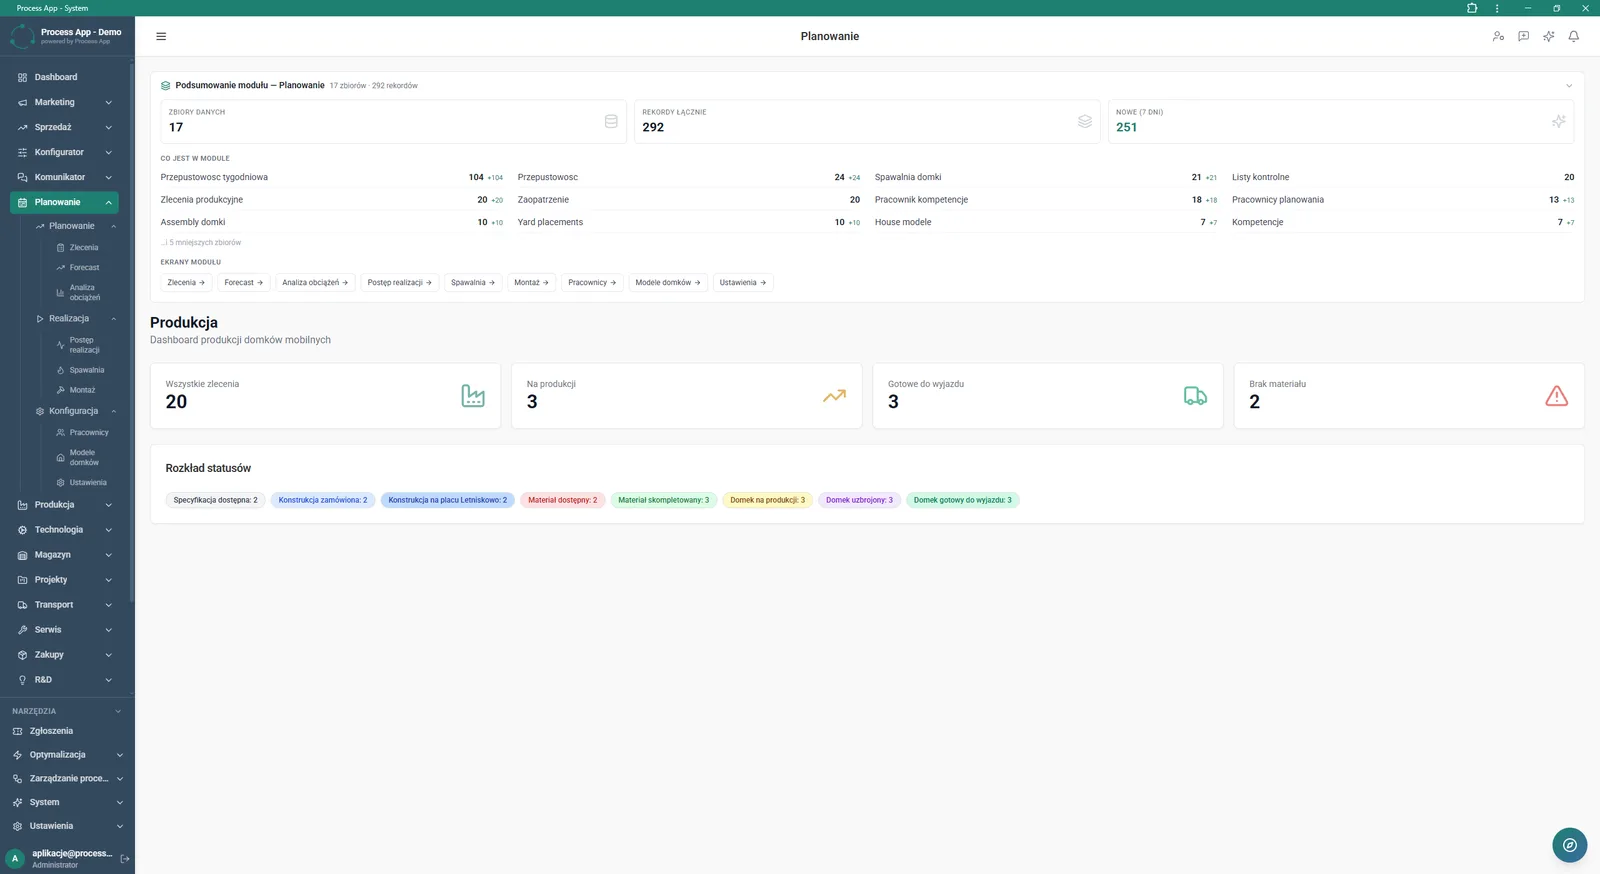
The Planning screen displays a module summary with dataset statistics and a production dashboard for mobile homes with numeric tiles and status distribution.
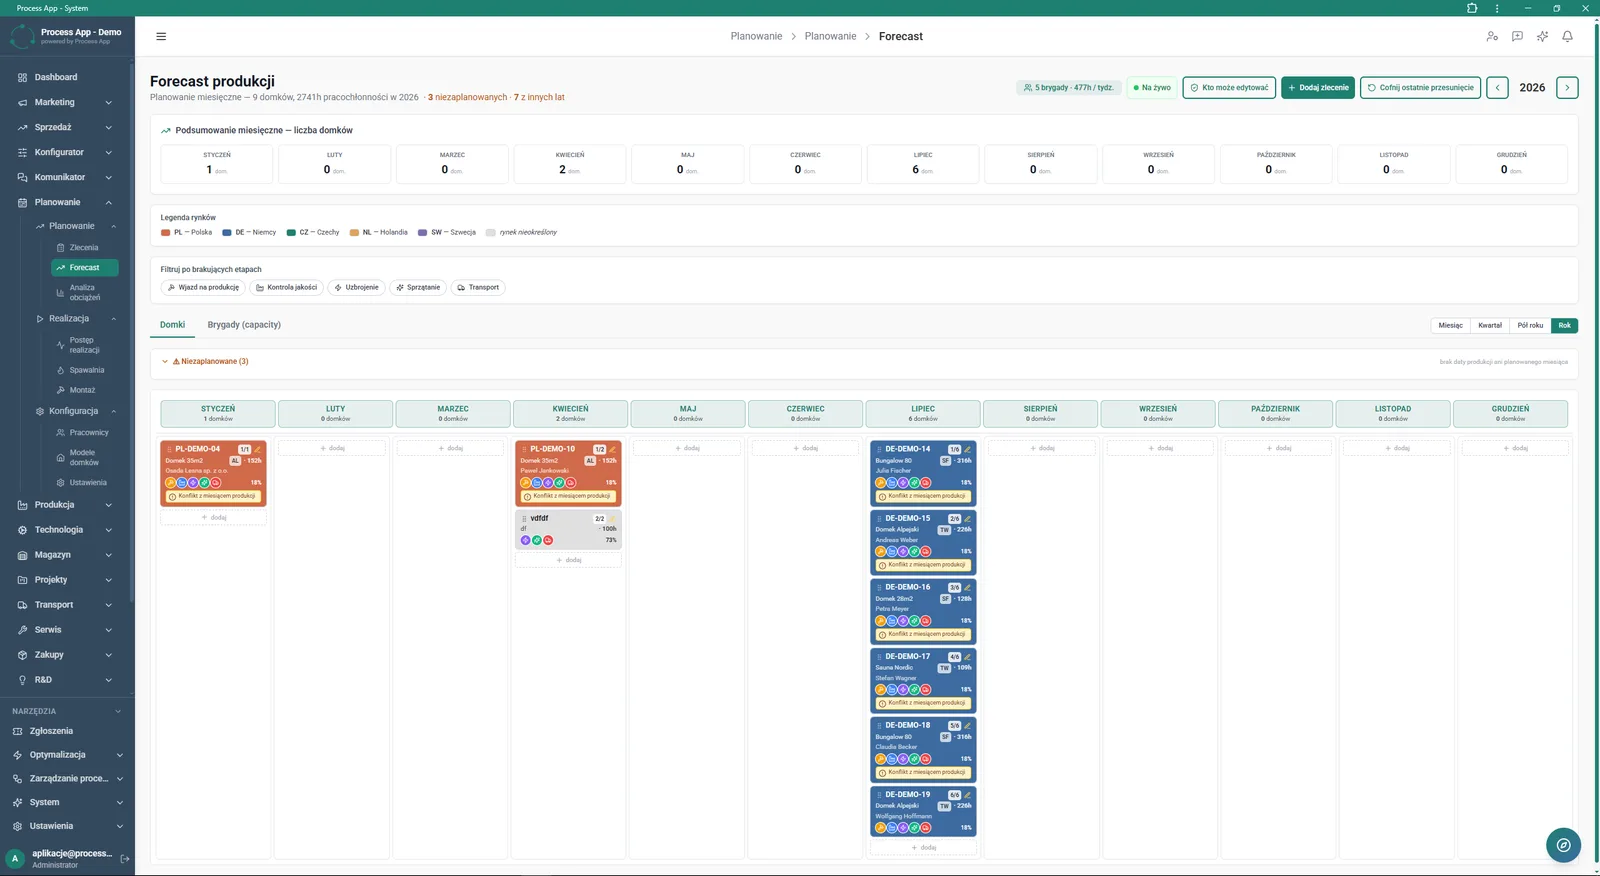
The production Forecast screen shows the annual production plan for homes by month, with tiles for orders assigned to each period and numeric summaries.
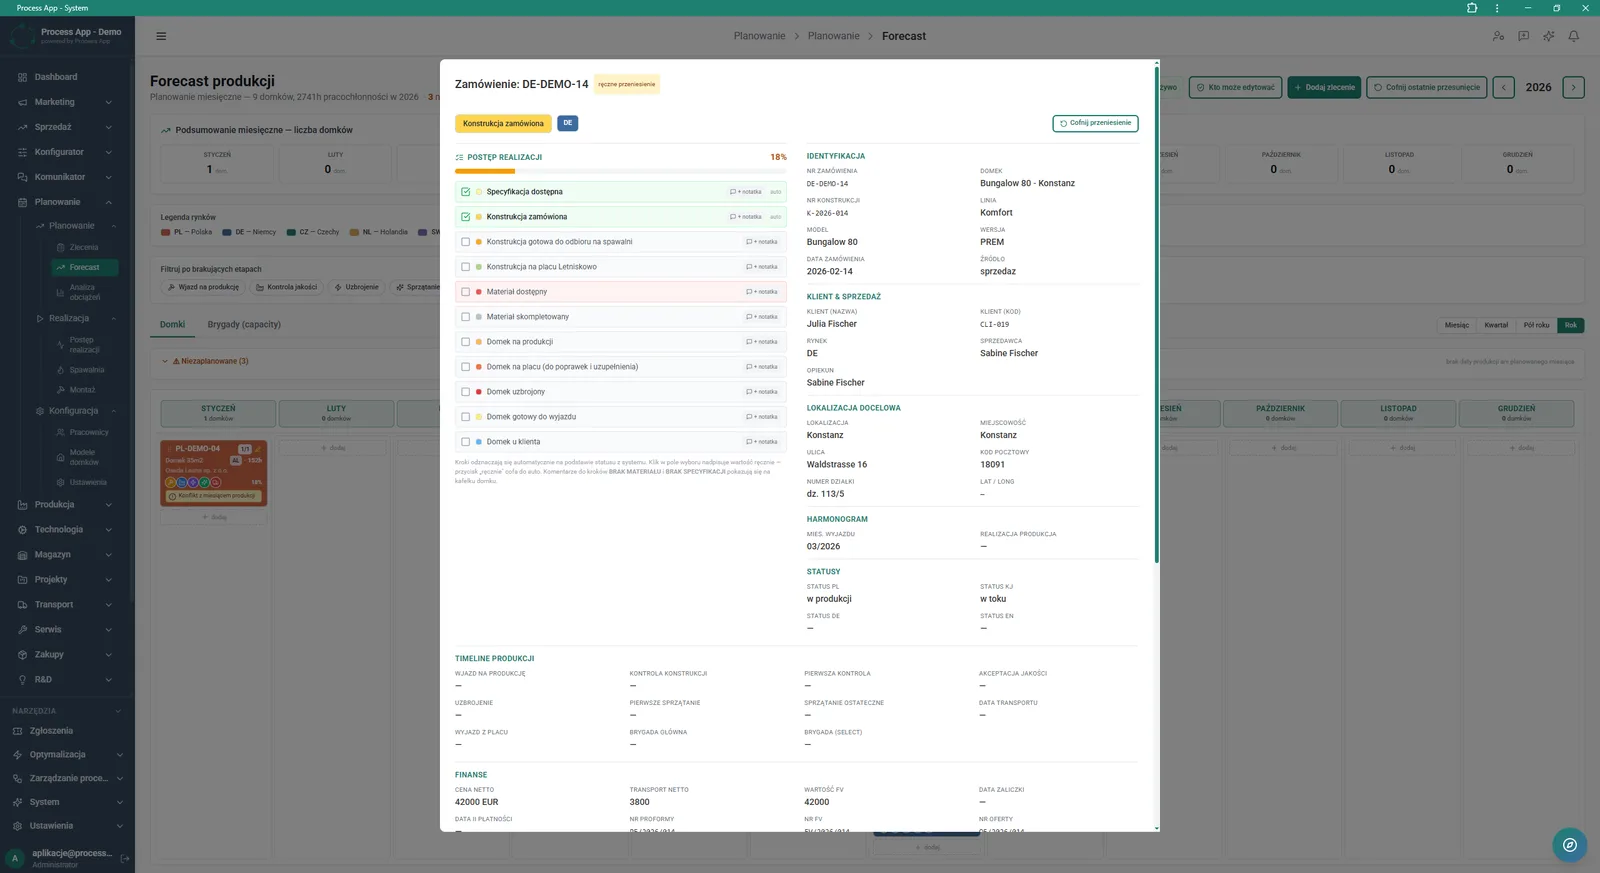
The production Forecast screen with an open details window for a specific order, showing progress as a checklist and grouped identification, sales, logistics and financial data.
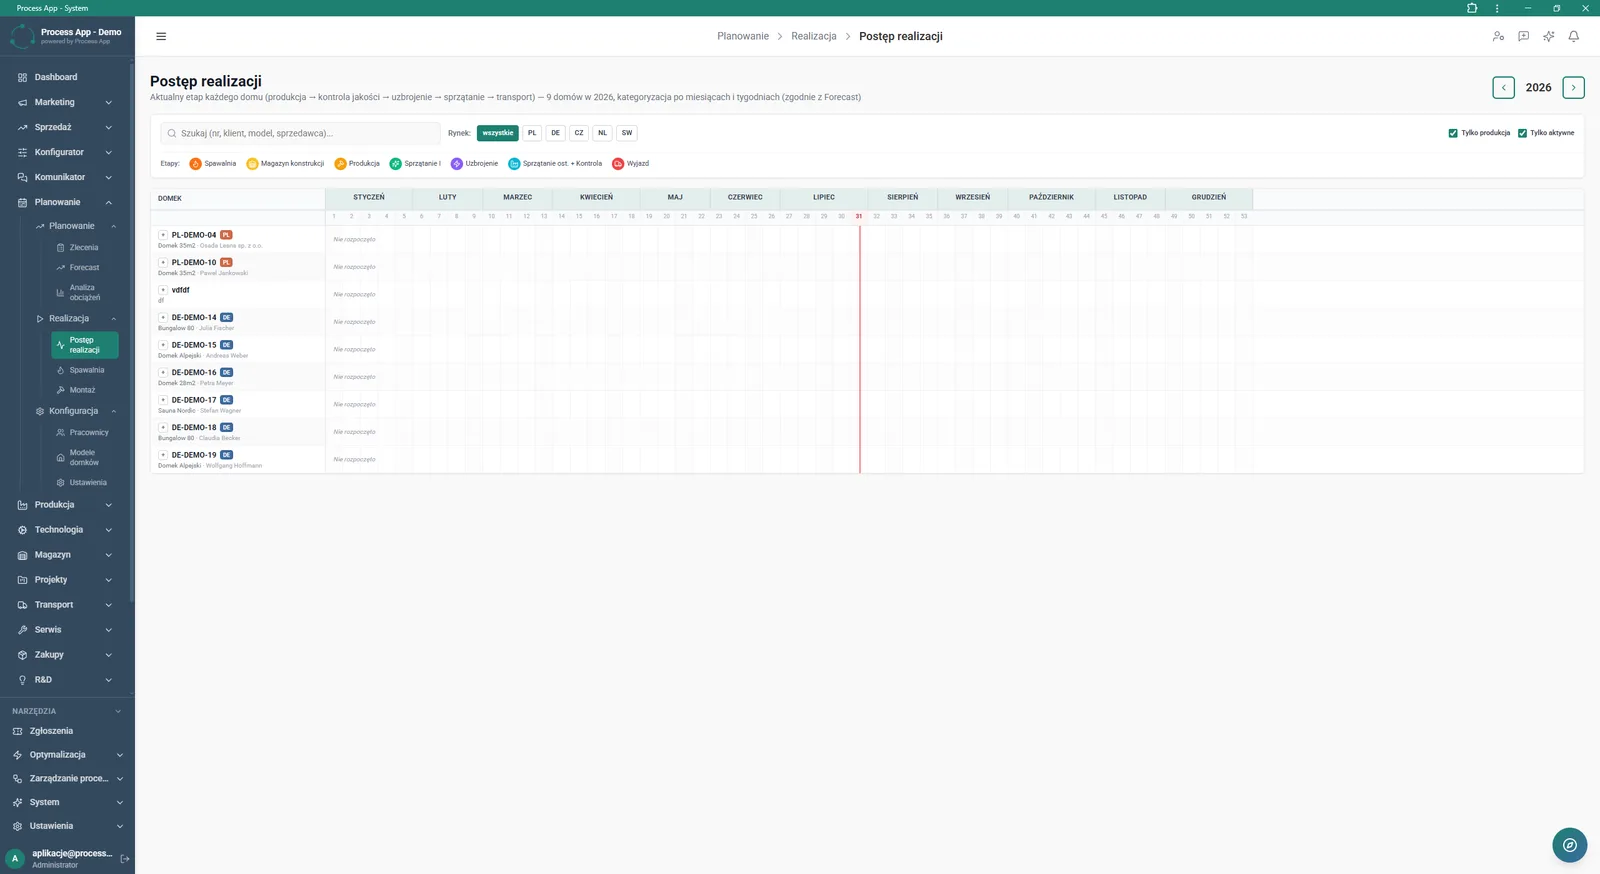
The Progress screen shows the annual production schedule for homes in a view broken down by months and weeks.
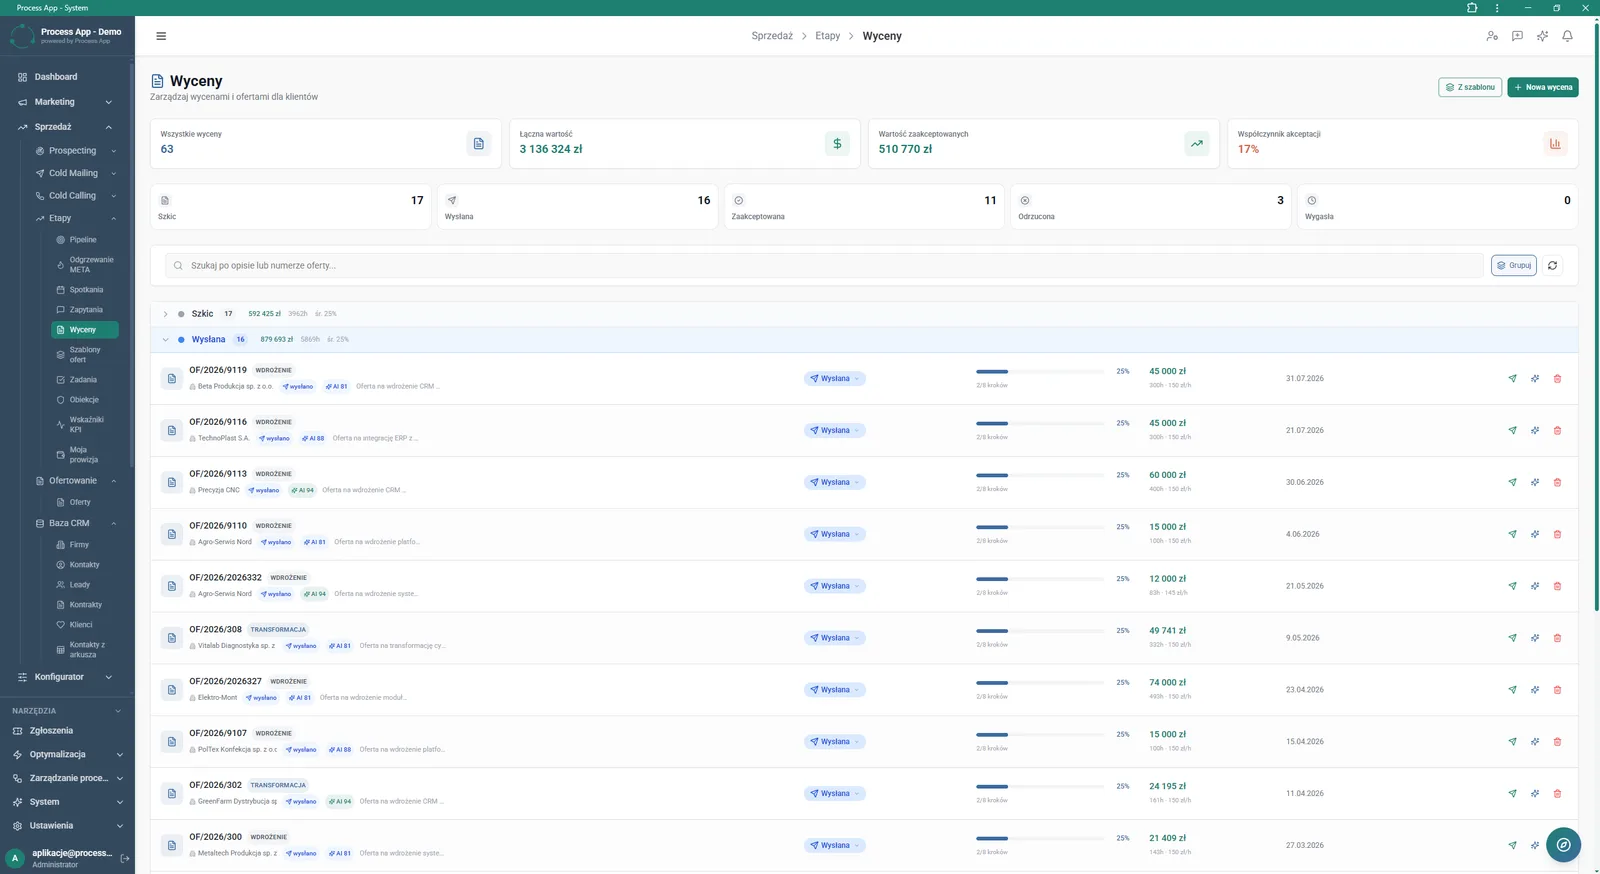
The Quotes screen shows a list of sales offers grouped by status, with tiles summarising total value and acceptance ratio.
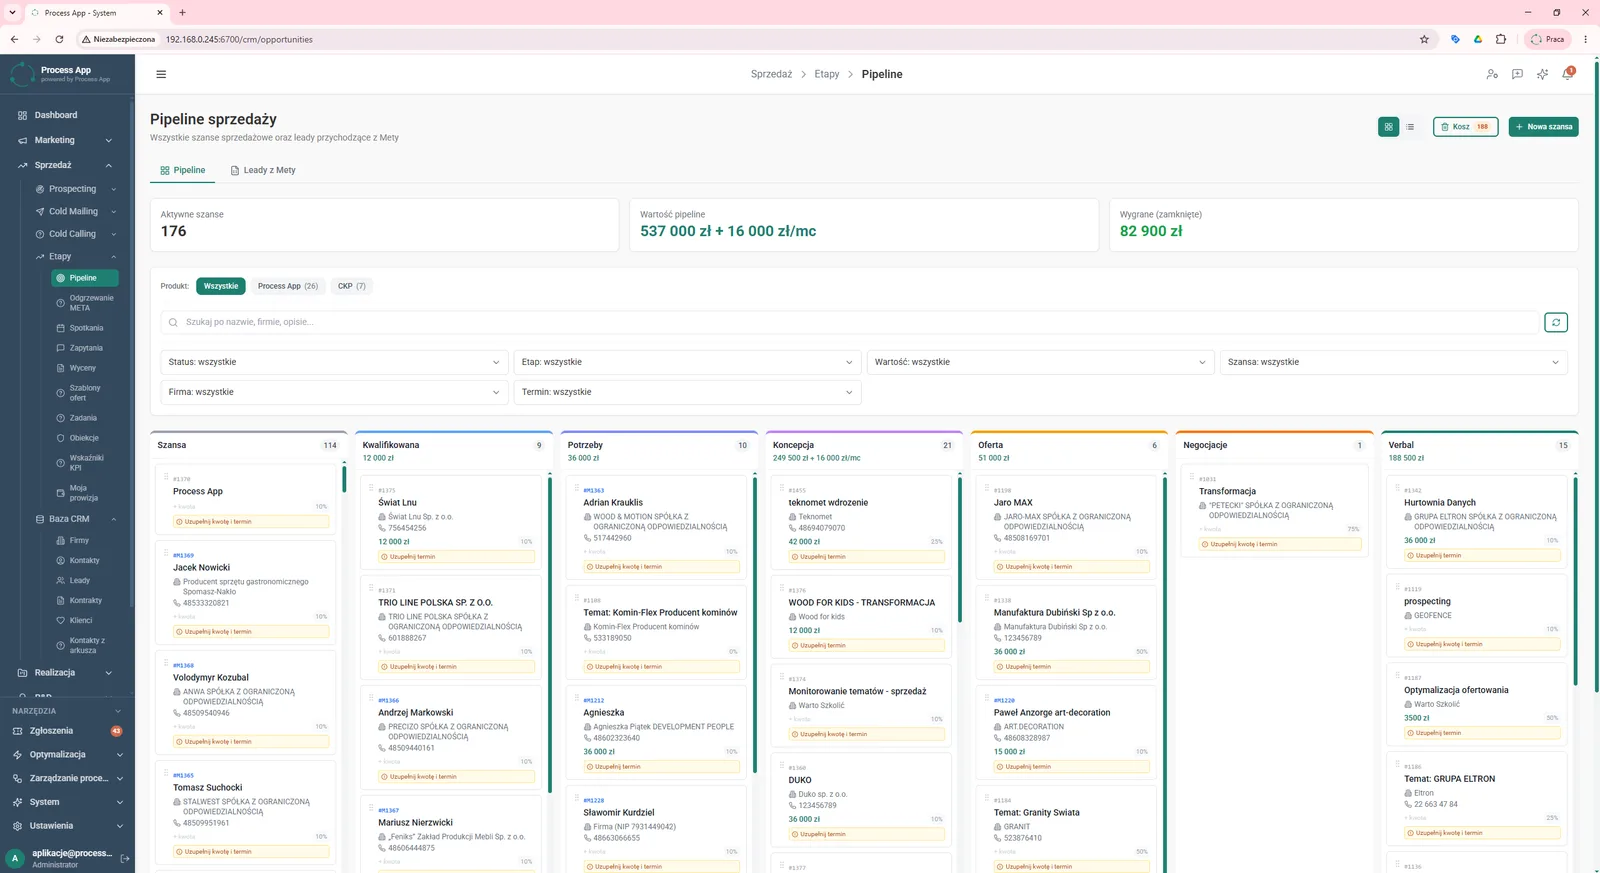
The Sales pipeline screen shows a kanban board with sales opportunities divided into stages, value summary tiles and a set of search filters.
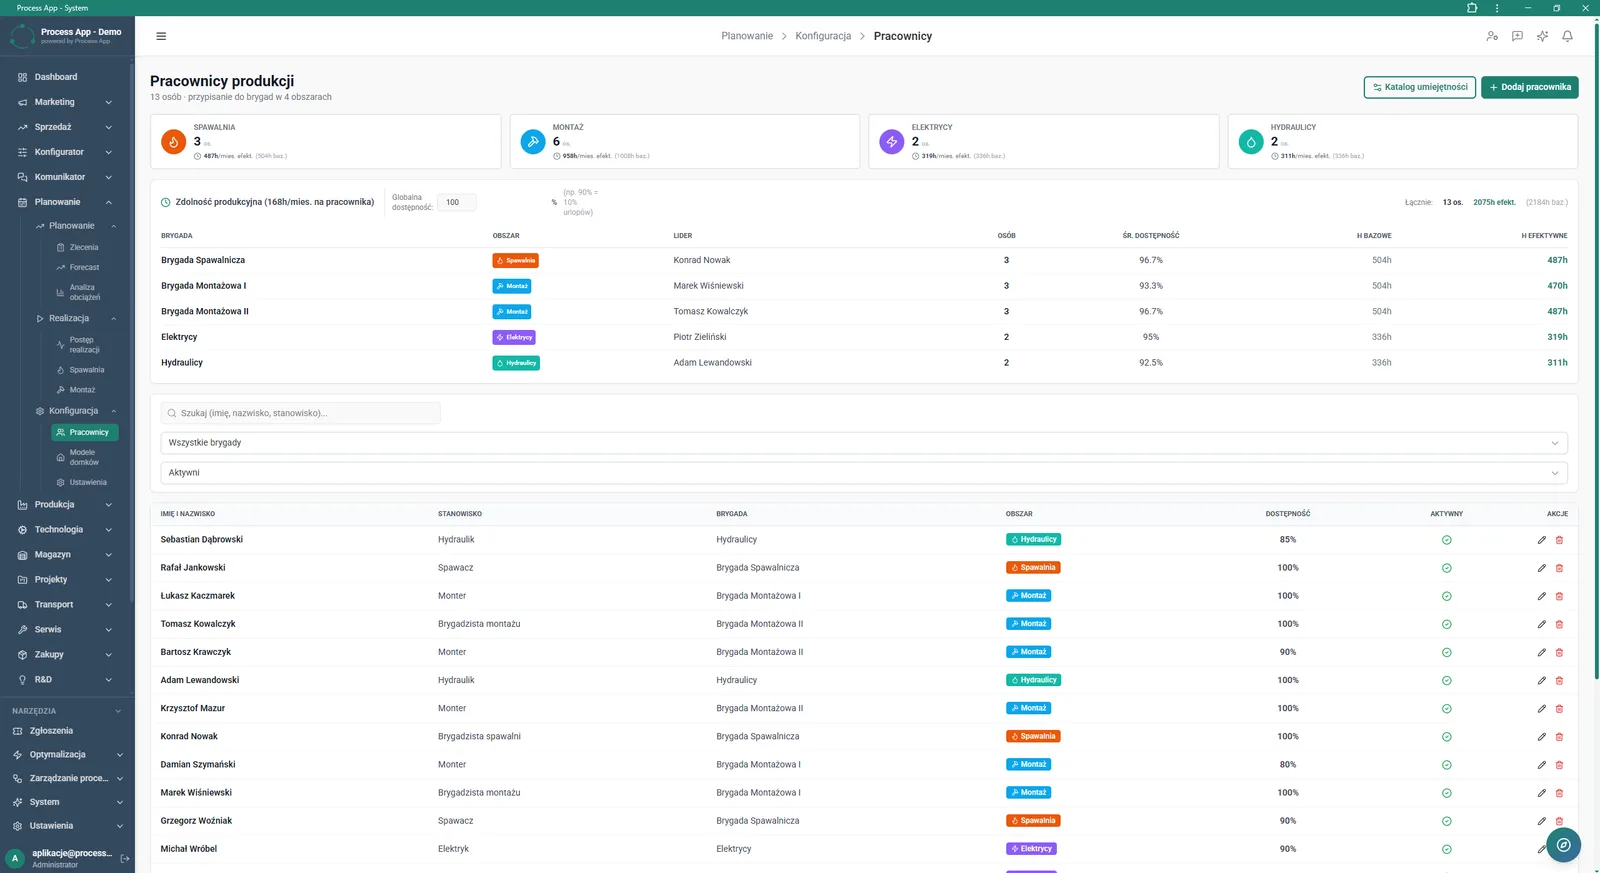
The Production workforce screen shows a breakdown of human resources by areas and crews, calculated available man-hours and a detailed list of employees.
What exactly you get
Annual production schedule
Displays the order plan in a grid broken down by months and weeks, with the option to change the time scale.
Sales kanban board
Displays sales opportunities divided into stages, including a summary of their total value.
Human resource management
Groups employees into crews and calculates their overall availability and capacity.
Order details
Shows execution progress in the form of a checklist and groups logistics and financial data.
Advanced data filtering
Enables searching orders and quotes by markets, statuses, stages or quote numbers.
What AI does for you in this process
Production workload prediction
AI analyses historical sales data and the current pipeline to forecast resource demand for the coming quarters.
Schedule conflict detection
AI automatically identifies the risk of overlapping orders in the planning grid and warns when crew availability is exceeded.
Sales opportunity scoring
AI analyses the time each opportunity spends in individual kanban stages and estimates the probability of winning the lead.
The process from start to finish
Plan an annual production schedule in a clear view broken down by months and weeks. Verify the progress of individual orders using detailed checklists and progress bars on the Order details screen. Manage sales opportunities on a kanban board in the Sales pipeline view, smoothly turning them into quotes and production orders. Control team workload by checking the availability of individual crews and calculating both nominal and effective man-hours. Assign orders to specific periods and, if needed, quickly roll back the last moves made in the plan. Filter data by markets, missing stages or statuses to get a complete picture of the situation, from the initial construction order to dispatch of the finished home to the customer.
See this process on your own data
We will walk you through the “Demand Forecasting (Forecast)” module using your company as the example — the input, the flow and the end result in Process App.
Explore the remaining system modules
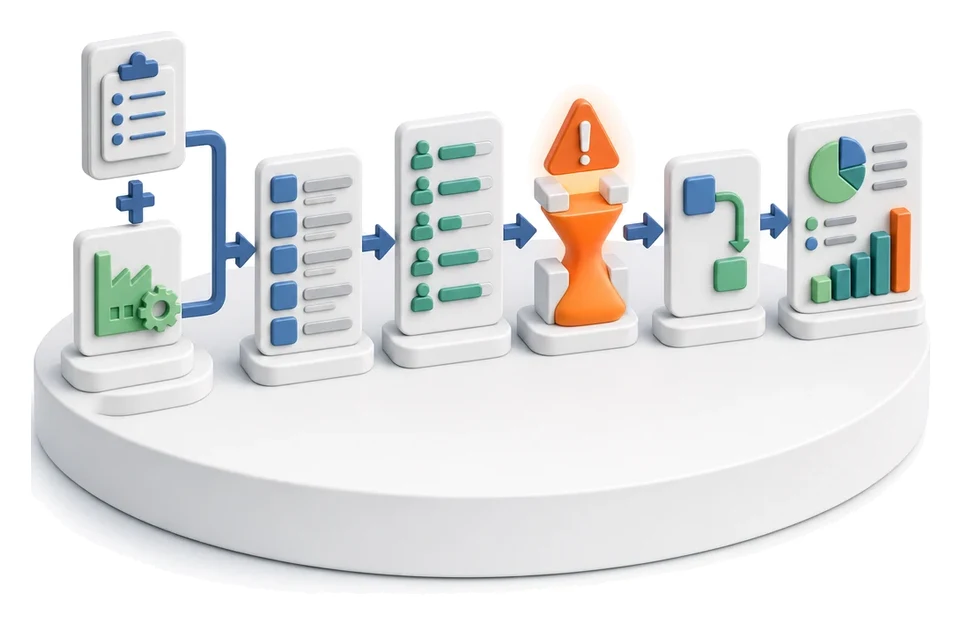
Resource Planning and Workload Analysis
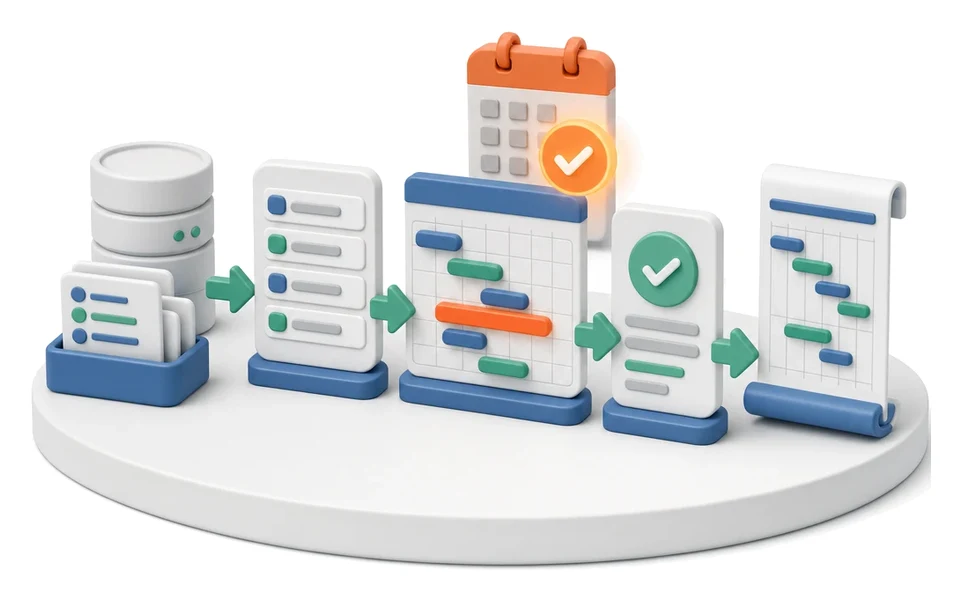
Production Scheduling
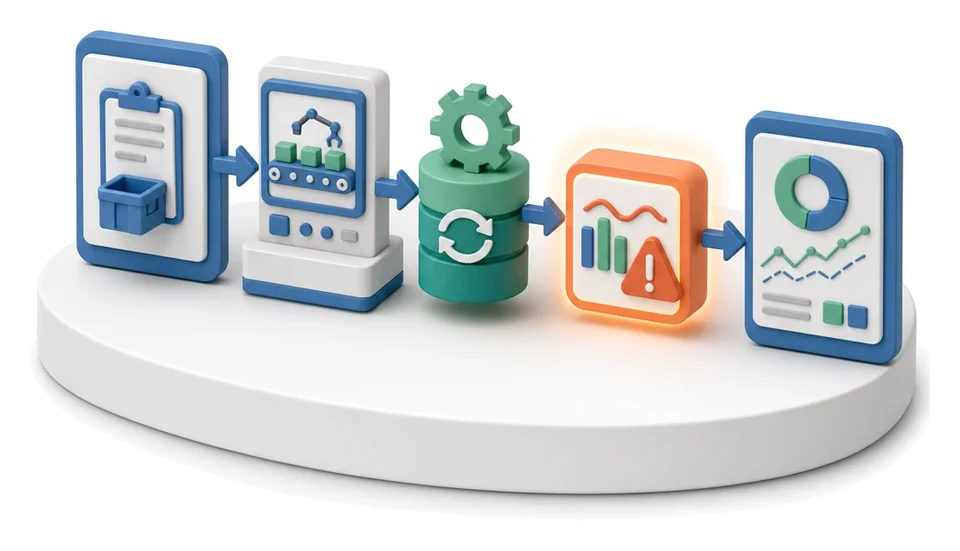
Execution Progress Monitoring
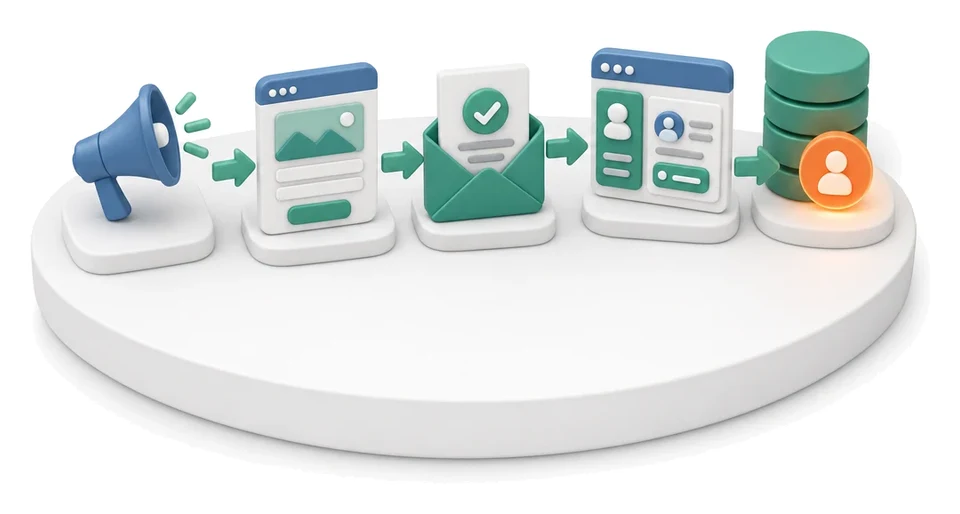
Lead Generation
Prospecting
Cold Mailing
Cold Calling
Sales Opportunity Management
Quotation Preparation
Offer Preparation and Sending
Product Configuration
BOM Development
Resource Planning and Workload Analysis
Production Scheduling
Execution Progress Monitoring
Lead Generation
Prospecting
Cold Mailing
Cold Calling
Sales Opportunity Management
Quotation Preparation
Offer Preparation and Sending
Product Configuration
