How an MES System Eliminates Paper on the Shop Floor and Production Downtime
See it on video
A step-by-step walk through the module — the same screens this write-up describes.
What is in the recording
- 0:00Introduction and the problem with paper-based reporting
- 0:05Manager's central dashboard and time regained
- 0:20Digital product card and instant BOM editing
- 0:56Interactive schedule and Gantt chart
- 1:36Digital terminals for shop floor operators
- 2:11Instant response to material shortages
- 3:07Real-time analytics and summary
The Challenge
Replacing paper reports with digital terminals and an interactive schedule delivers full real-time control over production and eliminates downtime.
Production planning and technology modifications (BOM) required manual data re-entry, making it difficult to respond quickly to changes. There was no real-time visibility into material shortages, and operators reported work completion on paper, which delayed access to progress information.
Key challenges:
- Production planning and technology modifications (BOM) required manual data re-entry, making it difficult to respond quickly to changes.
- There was no real-time visibility into material shortages, and operators reported work completion on paper, which delayed access to progress information.
How the deployment ran
A ProcessApp MES system was implemented with a module for editing product structure (BOM) and verifying material shortages. An interactive Gantt chart schedule with drag-and-drop planning was launched, along with digital terminals for operators to record time and the quantity of units produced.
Step by step
The steps taken by the implementation team — from mapping the process to going live.
The implementation team mapped the existing order management processes and transferred them into the ProcessApp MES system.
A central management dashboard and interactive schedule were configured, and production terminals were launched directly at workstations.
What works after go-live
What actually works in the system after the deployment — every one of these screens appears in the recording above.
Morning Review
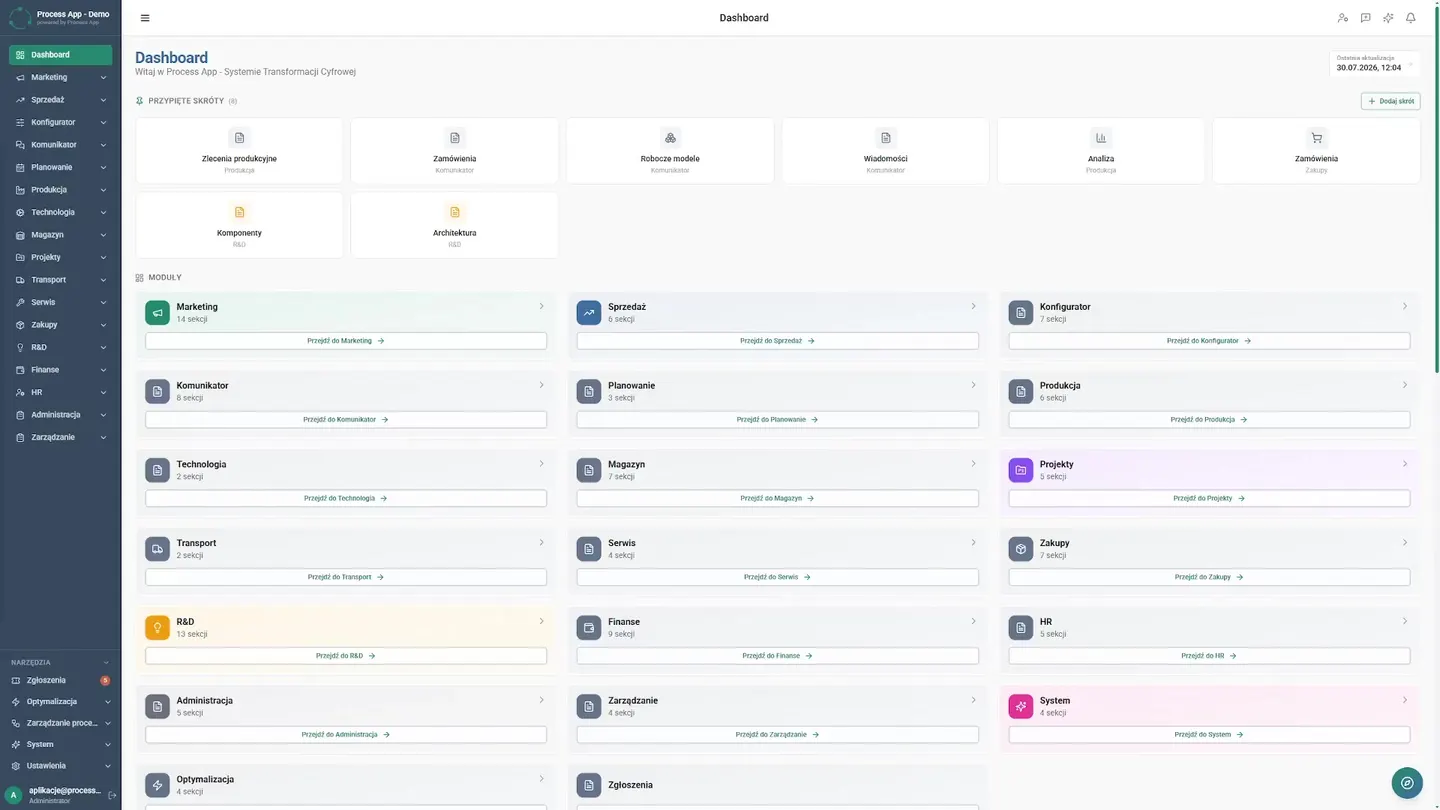
Previously, the production manager started the day by collecting statuses from paper slips, which cost him several morning hours. Today he opens the central dashboard. He immediately sees key indicators, charts, and the full order list. The team regained instant control.
Digital BOM
Changing a technology or product structure once required manual data re-entry, carrying the risk of errors. Now the planner opens an order and navigates to the digital product card, editing components and operations in one place, without paper. The team modifies the BOM structure and saves changes, making updates instantly visible across the company. This eliminated human errors, and preparing documentation for a new order has been reduced from several hours to just a few minutes.
Interactive Schedule
Building schedules became a bottleneck when paper plans could not keep up with changes on the shop floor, causing delays. Implementing an interactive schedule changed the rules of the game. The planner uses a clear Gantt chart, dragging and dropping tasks along the timeline. Within seconds, the plan is adjusted and the updated schedule is saved, with the system ensuring consistency. The company gained flexibility, and production planning stopped being a risky guessing game.
Live Reporting
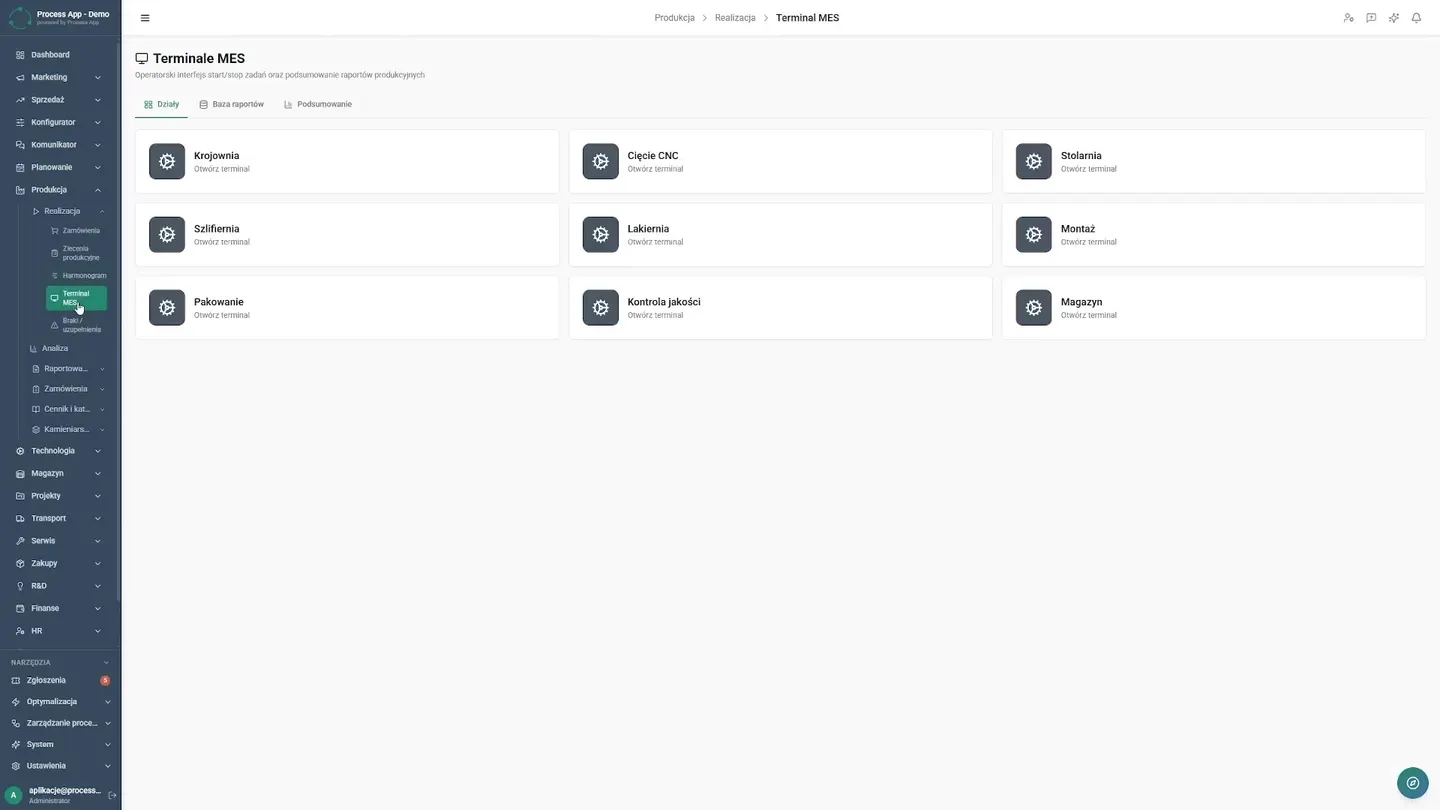
The biggest change, however, took place directly at workstations. Previously, operators filled out paper job cards only after the shift ended, so information arrived with a significant delay. Today they have simple digital production terminals in front of them. With a single touch, an operator starts a new operation, and at a neighboring station effortlessly completes an ongoing one, immediately entering the exact number of units produced. Data reaches the central database instantly. The team has completely eliminated paper from the shop floor, and management knows exactly what is happening with every single order at any given second.
Instant Response
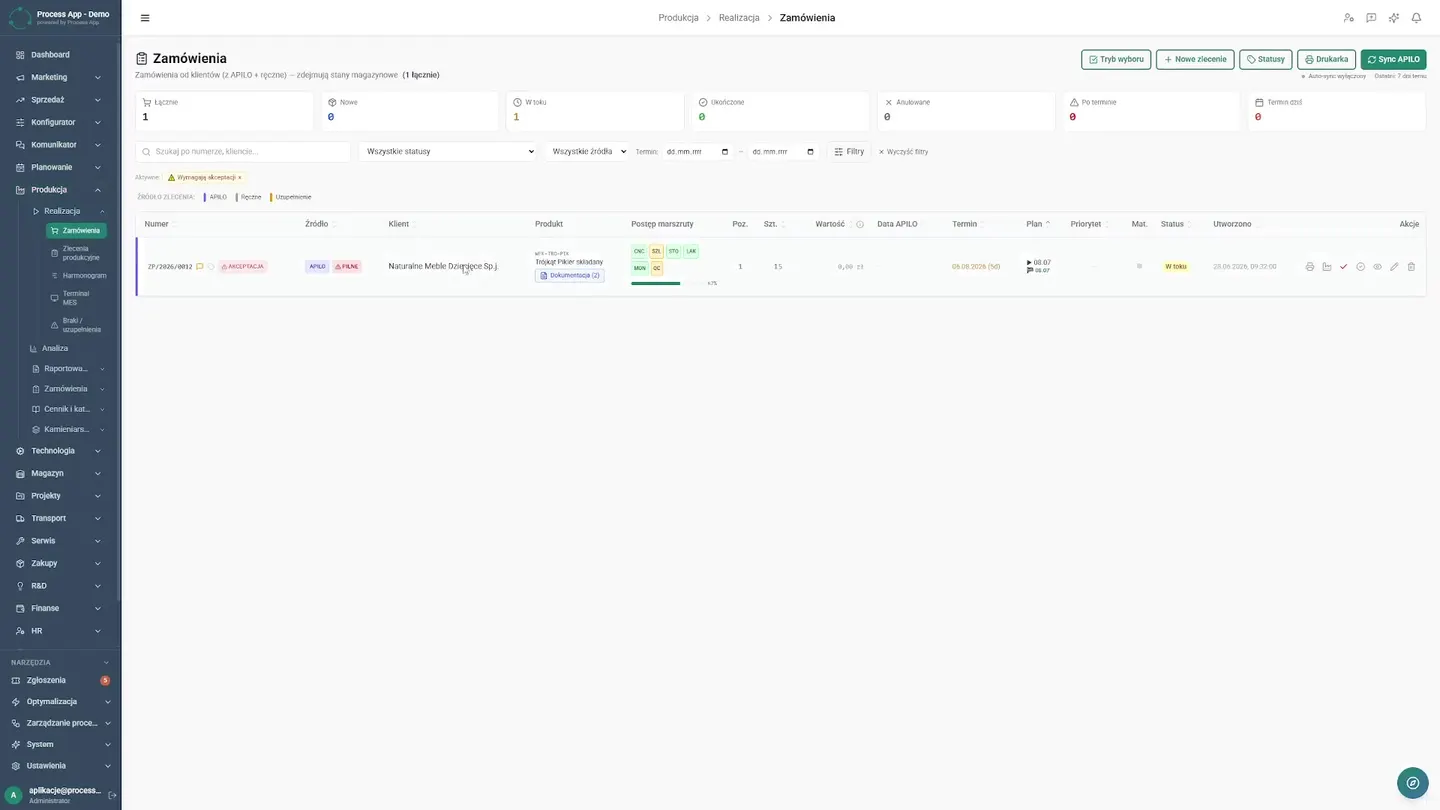
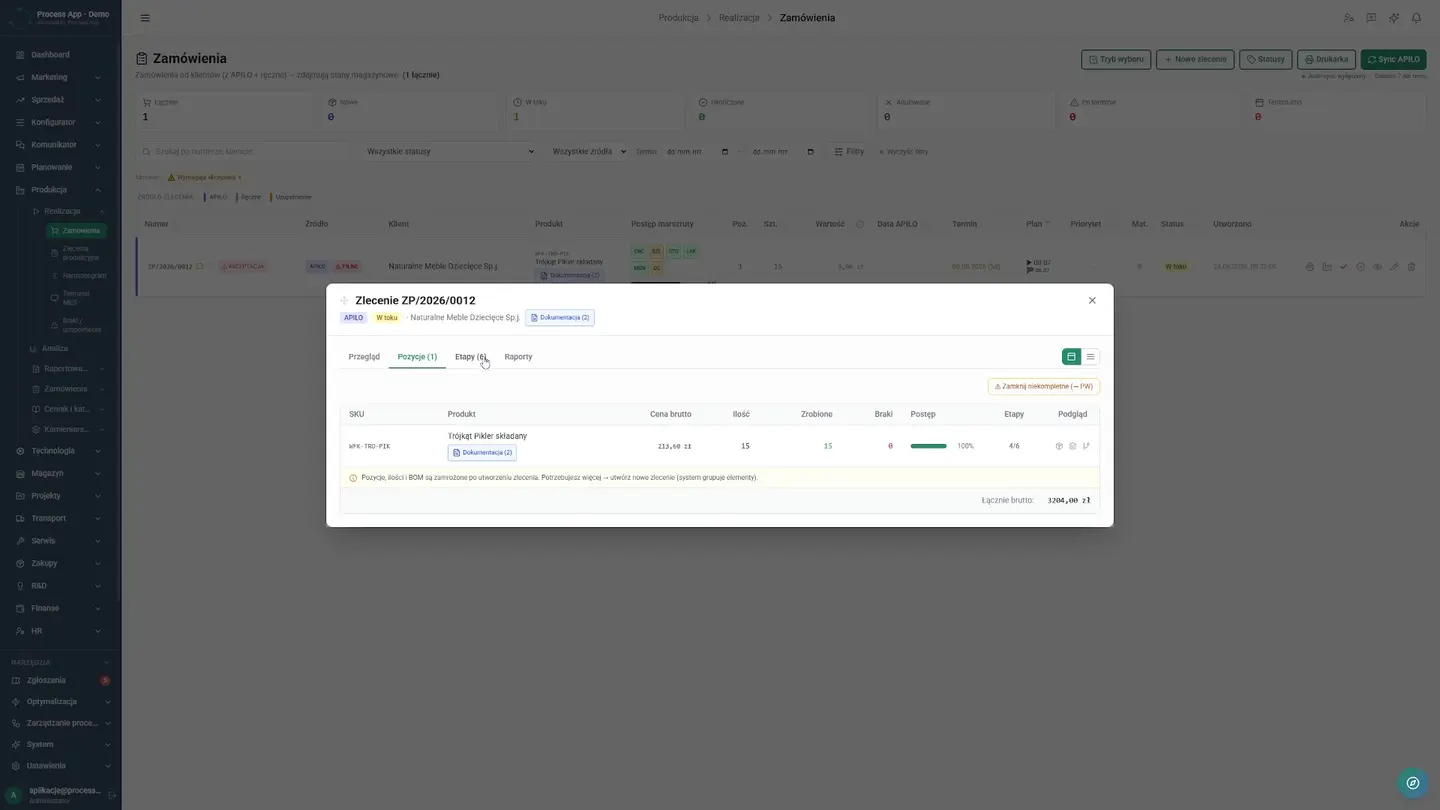
Because data flows in continuously, the planner can react with unprecedented speed. Previously, raw material shortages only came to light at the machine, brutally halting the entire line. Today it takes just a few clicks. The team calmly reviews detailed reports from completed operations — for example from CNC cutting — seeing actual consumption. The planner then moves to the production order view. The extensive list is quickly filtered to find the order of interest, and its details are opened immediately. Right away, a clear list of missing materials assigned to that specific order is visible. There is no longer any need to call the warehouse or wait for a manual inventory check. Full clarity is available long before the raw material is actually needed on the shop floor. This allows the company to replenish shortages well in advance, completely avoiding costly downtime and delivery delays.
Real-Time Analytics
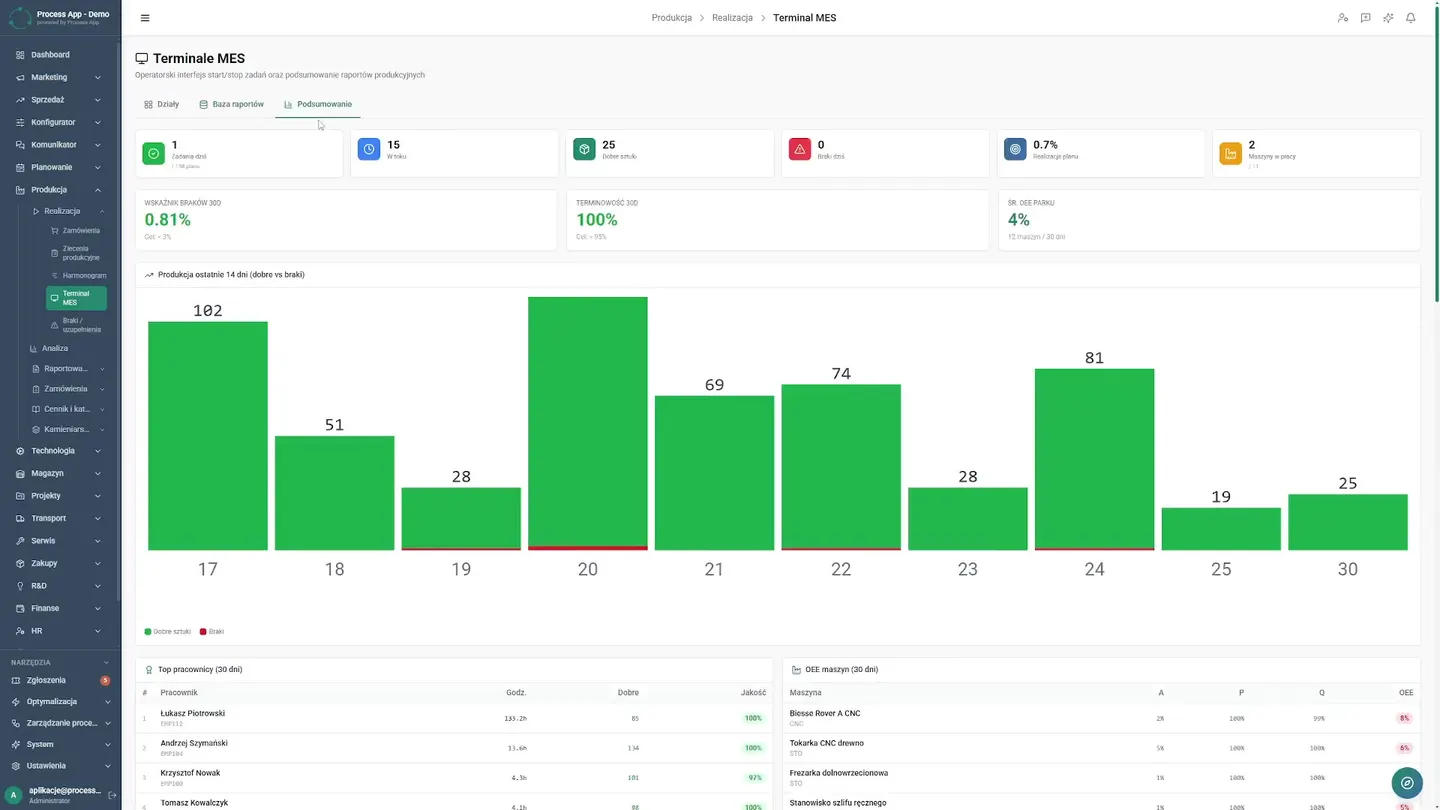
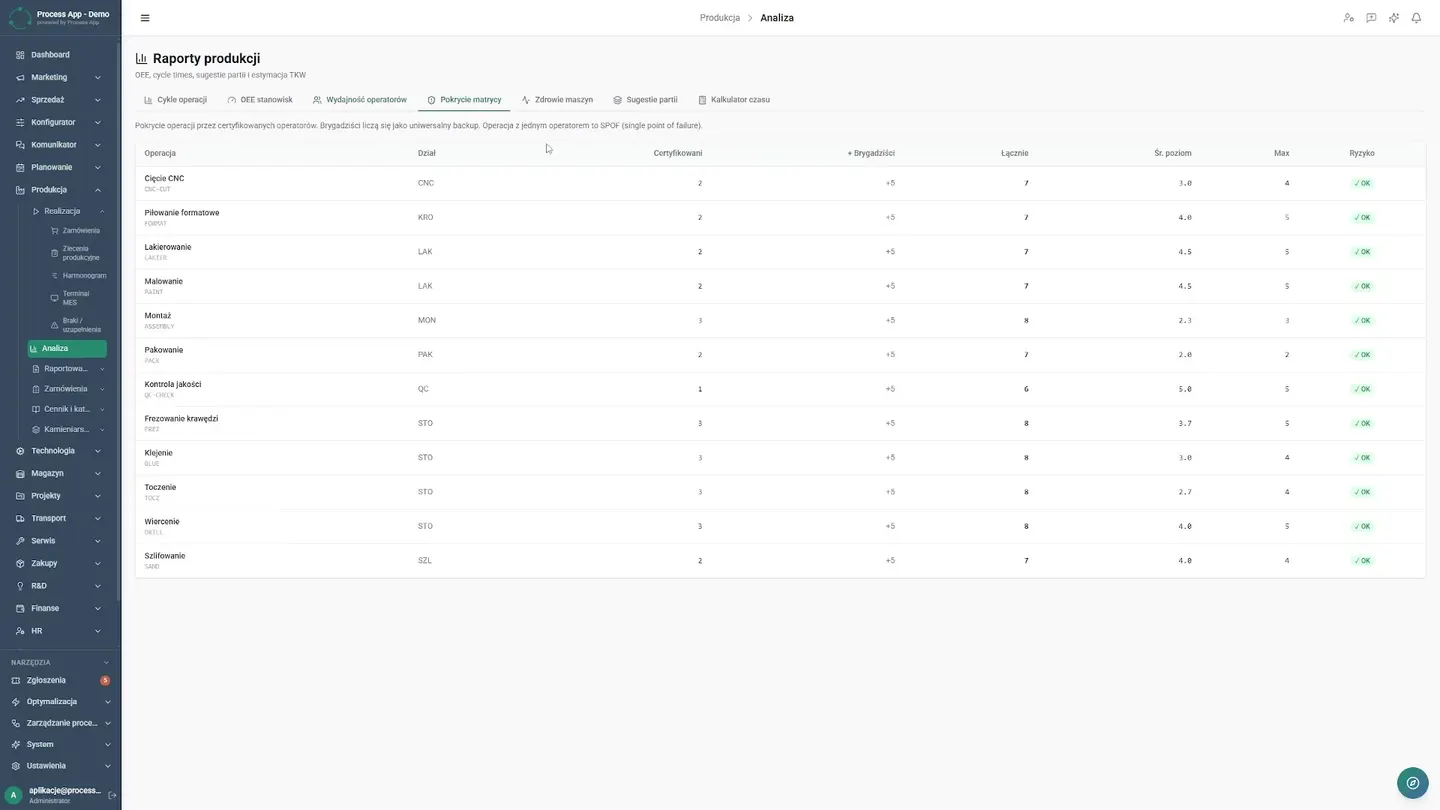
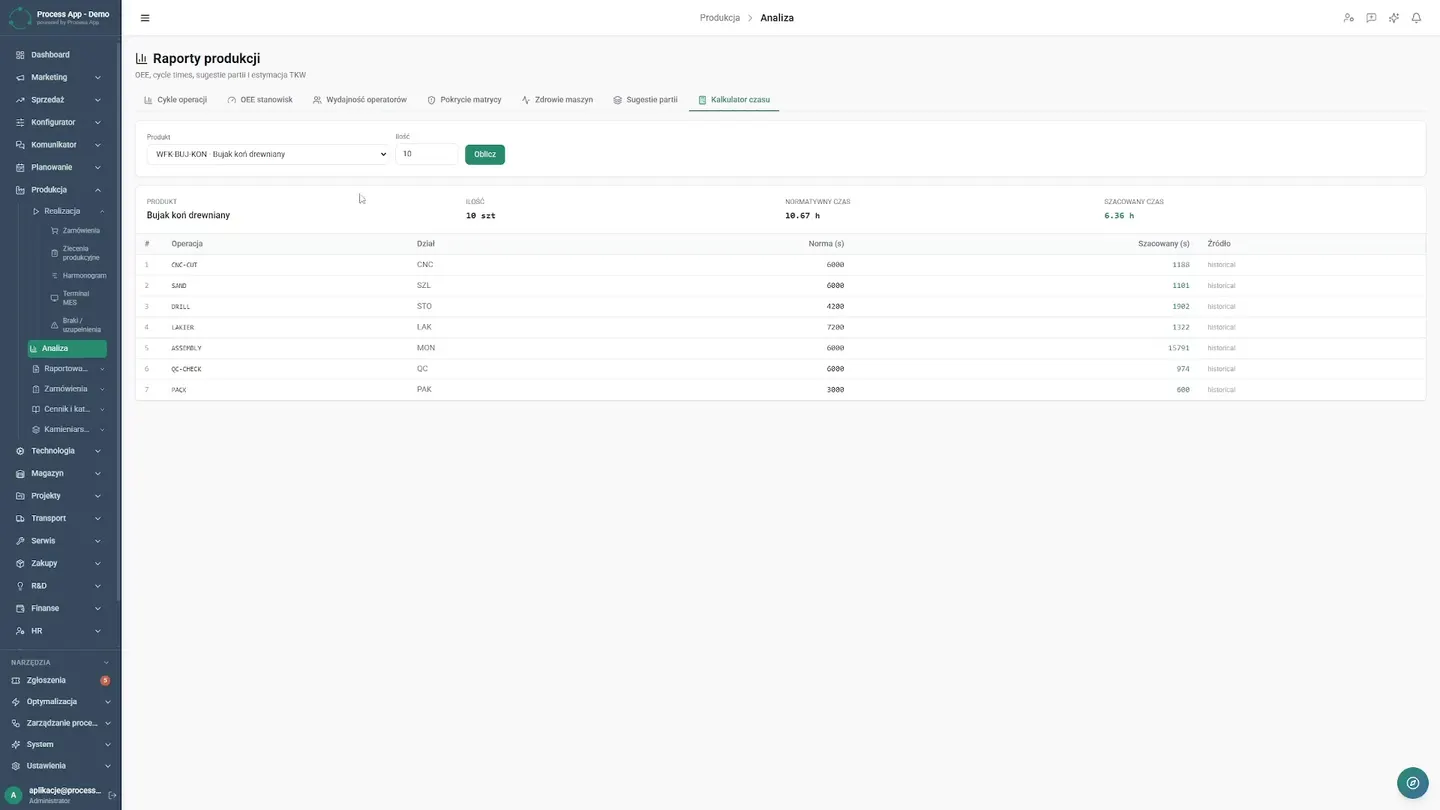
The entire process comes together in one place, giving management definitive proof of the implementation's effectiveness. Instead of spending Friday afternoons manually stitching together data from various spreadsheets, the production manager now has everything served up on a platter. He opens the operations log and summary analytical dashboards that aggregate data from terminals in real time. He sees efficiency, progress, and any potential bottlenecks without a moment's delay. The company gained not only hours of saved time, but above all the confidence that every decision is based on hard, up-to-date facts.
Results Achieved
What changed
Before the deployment
- Production planning and technology modifications (BOM) required manual data re-entry, making it difficult to respond quickly to changes.
- There was no real-time visibility into material shortages, and operators reported work completion on paper, which delayed access to progress information.
After the deployment
- The planner visually manages the schedule and immediately sees material shortages for a specific order.
- The production manager has access to live-updated analytical dashboards, because operators continuously report the start and end of operations on their terminals.
Screens from the deployment