How the Board Cut Problem Response Time from Weeks to Minutes
See it on video
A step-by-step walk through the module — the same screens this write-up describes.
What is in the recording
- 0:00From Chaos to Control
- 0:15Financial Analysis Without Scattered Spreadsheets
- 0:46One Coherent Strategic Plan
- 1:02KPI Cascade and the End of Silos
- 2:10Instant Corrections with the AI Assistant
- 2:38Ready-Made Summaries and Gantt Charts
- 3:59Build Your Strategic Plan
The Challenge
Implementing a centralized environment for strategy and KPI management cuts business problem response time from weeks to minutes.
Strategic objectives and KPIs were scattered across multiple spreadsheets, making it difficult to monitor progress and interdepartmental connections. Analyzing financial issues and delegating corrective tasks required lengthy meetings and manual transcription of conclusions.
Key challenges:
- Strategic objectives and KPIs were scattered across multiple spreadsheets, making it difficult to monitor progress and interdepartmental connections.
- Analyzing financial issues and delegating corrective tasks required lengthy meetings and manual transcription of conclusions.
How the deployment ran
The ProcessApp platform was deployed with modules for strategic plan management, KPI cascading, and A3 problem analysis. An AI assistant for summaries, Gantt views, and an integrated Kanban board for direct delegation of corrective tasks were also launched.
Step by step
The steps taken by the implementation team — from mapping the process to going live.
The company's organizational structure and the relationships between top-level objectives and the operational metrics of individual departments were mapped.
The entire strategic planning and reporting process was then migrated to a single, centralized environment.
What works after go-live
What actually works in the system after the deployment — every one of these screens appears in the recording above.
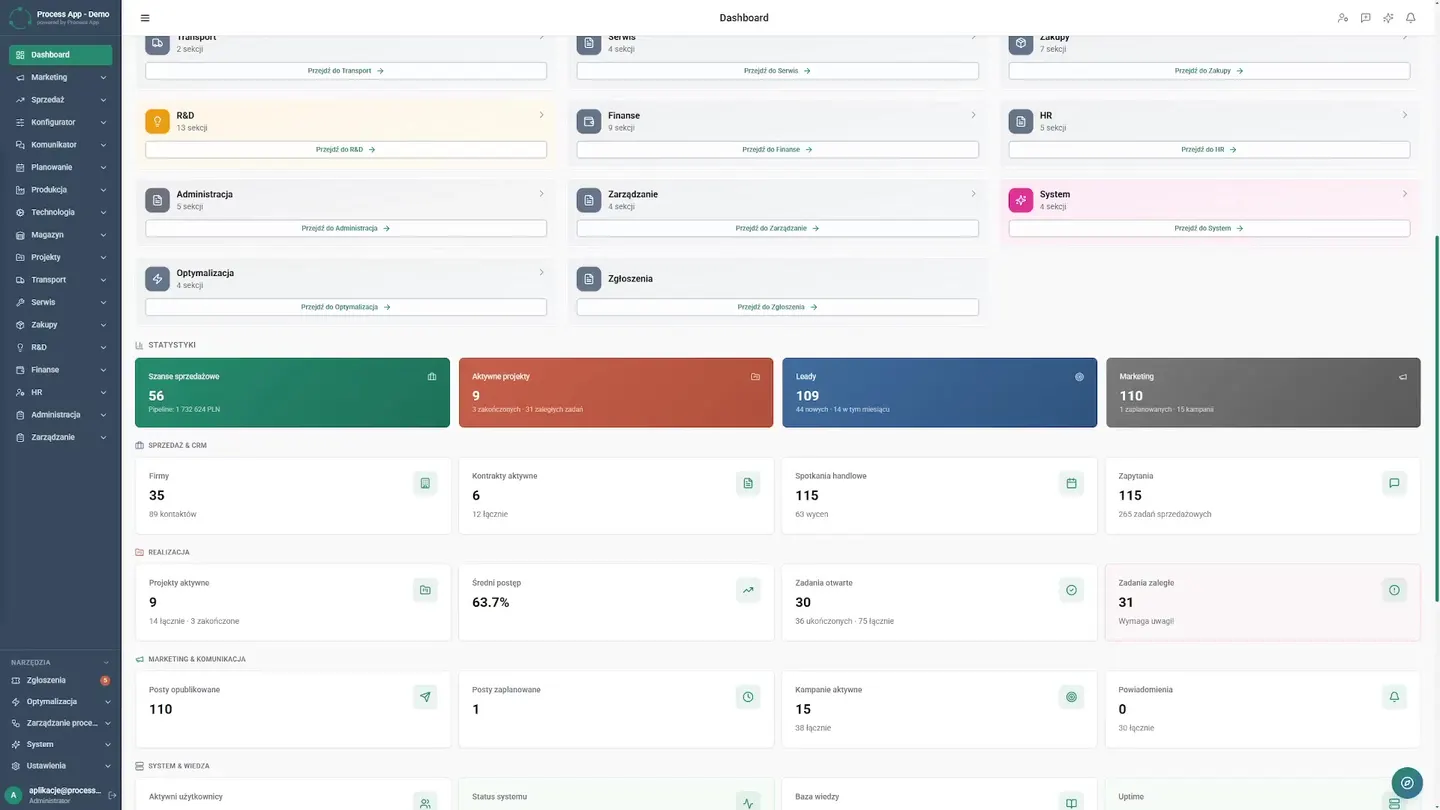
Company Overview
Today, an HR, finance, and sales review is a single view, delivering a complete picture of the situation in seconds.
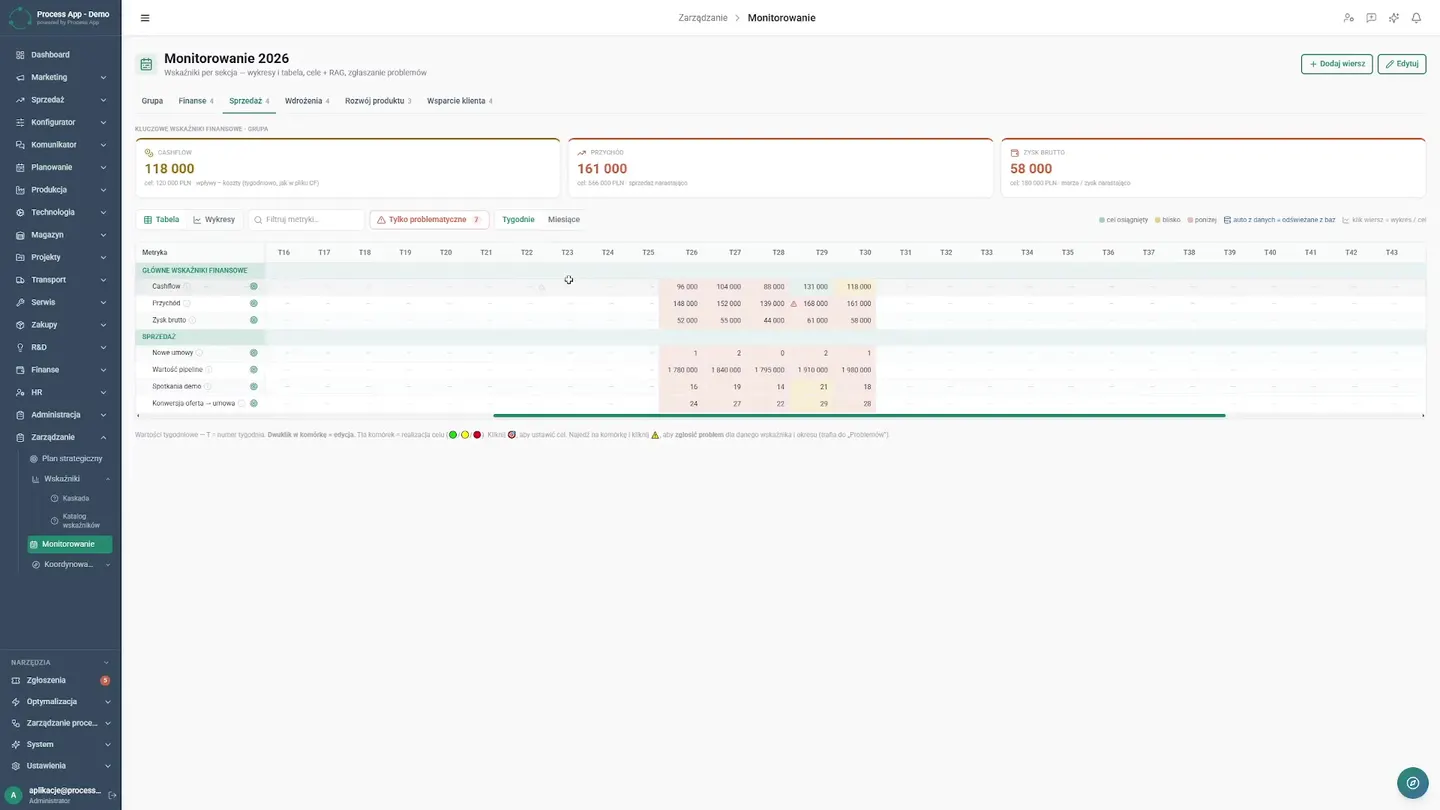
Financial Analysis
In the past, a drop in gross profit meant frantically searching through scattered spreadsheets and endless explanatory meetings. Today, the board simply opens the financial module. Monthly statements in the table immediately reveal real trends. Instead of waiting for analysts to do the work, the director seamlessly switches to a clear chart view. Detailed gross profit analysis is opened instantly, and the source of variances is identified immediately. The company knows exactly where money is being lost, and problem response time drops from weeks to minutes.
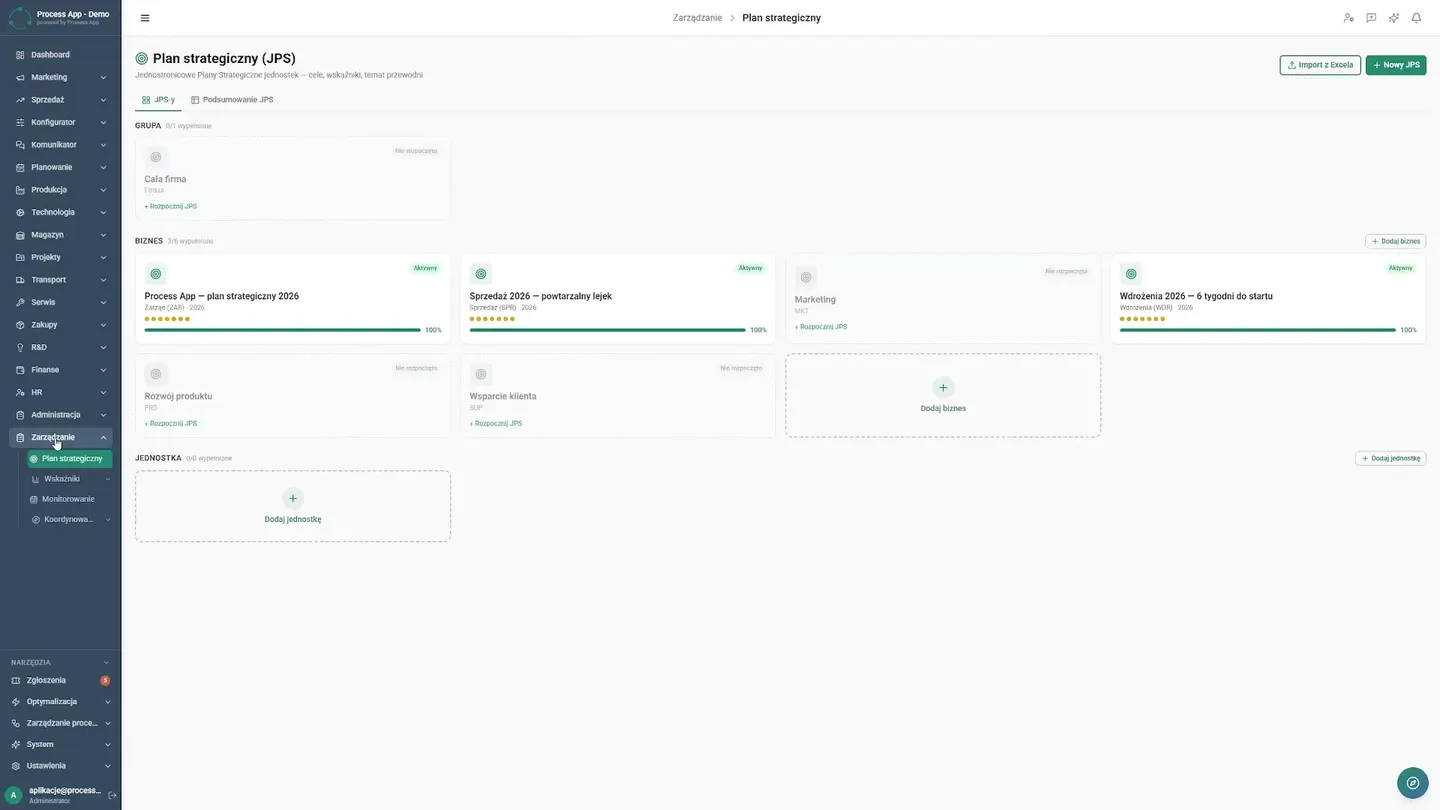
One Strategic Plan
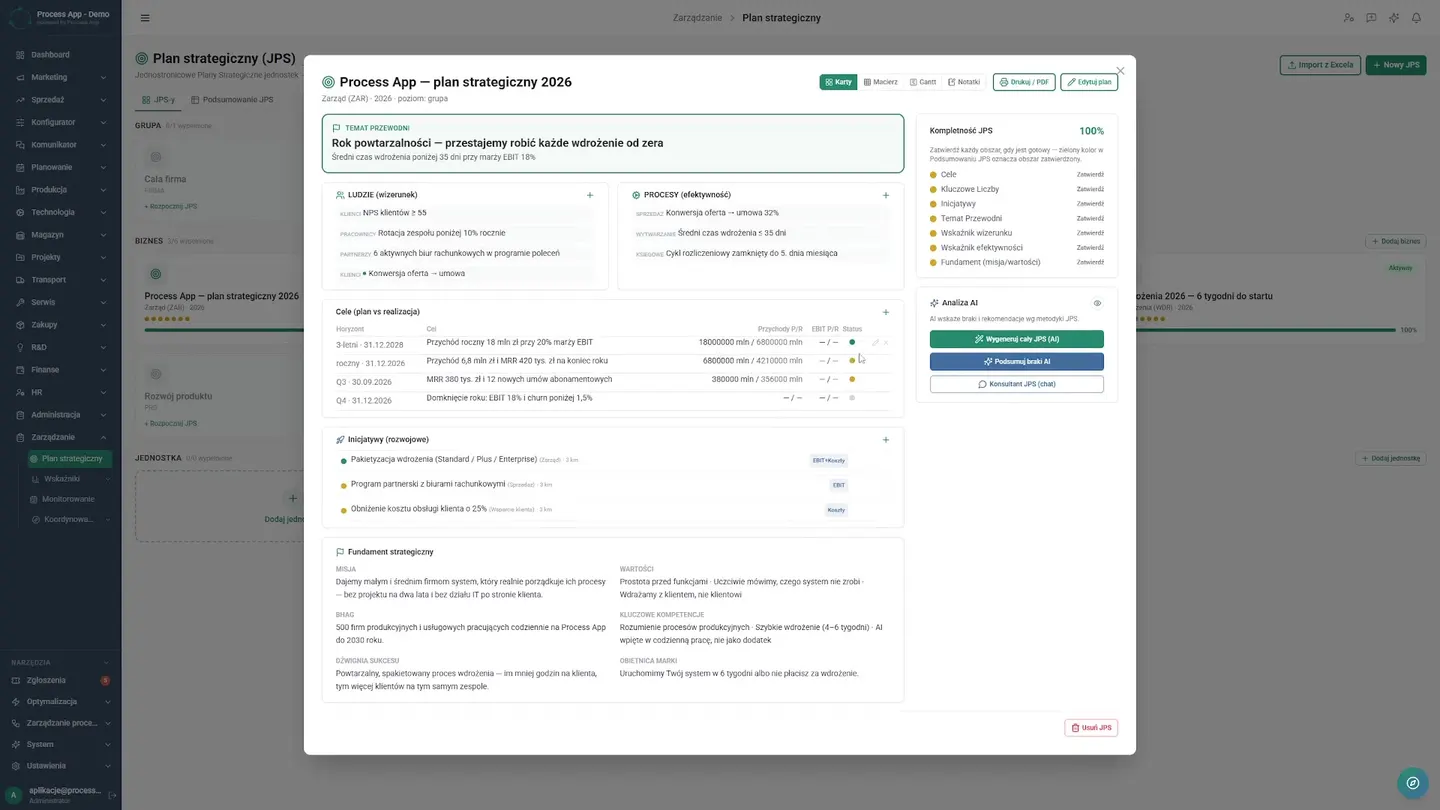
The company's strategic planning moved to a clear format, and the master plan for 2026 presents a structured list of objectives and metrics, giving the board full transparency into operations.
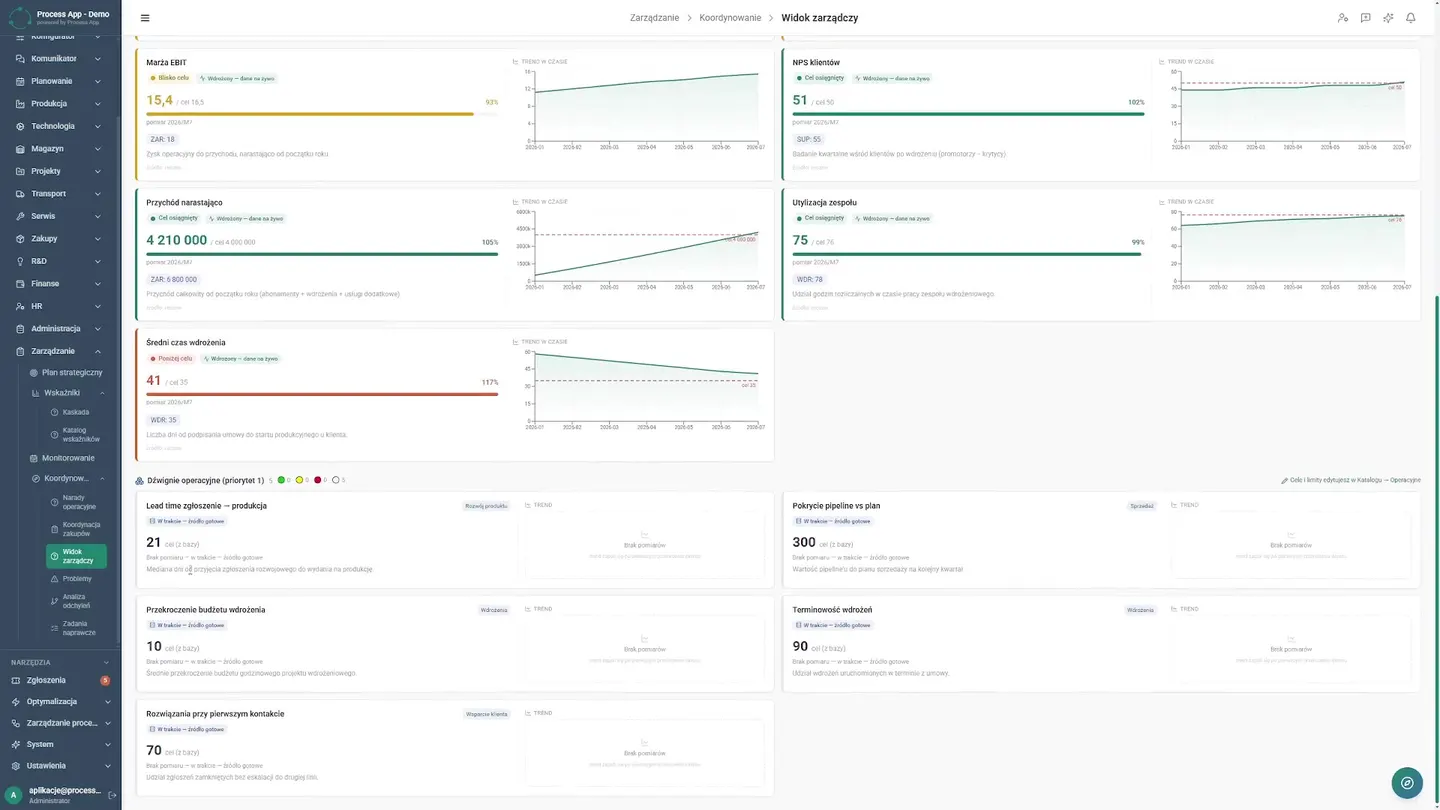
KPI Cascade
When the company's top-level goals were disconnected from day-to-day work, individual departments operated in closed silos. Mapping the organizational structure and migrating it to a central system completely changed the rules of the game. Today, the board navigates the KPI cascade seamlessly, with a clear, visual dashboard in front of them. The interactive dependency map clearly and unequivocally shows how the operational metrics of marketing or sales directly impact the company's global financial objectives. No one guesses who is responsible for a given result anymore. The director simply navigates to the extensive metrics catalogue, where every key measure has an assigned owner and a precise definition. Opening the details of a single metric allows for an immediate analysis of its current status and historical trends. This is the definitive end of blame-shifting during lengthy board meetings. The entire company has gained a coherent environment in which every number stems from the work of a specific team. Management has constant, hard visibility into whether the established strategy is actually working in practice.
Instant Corrections
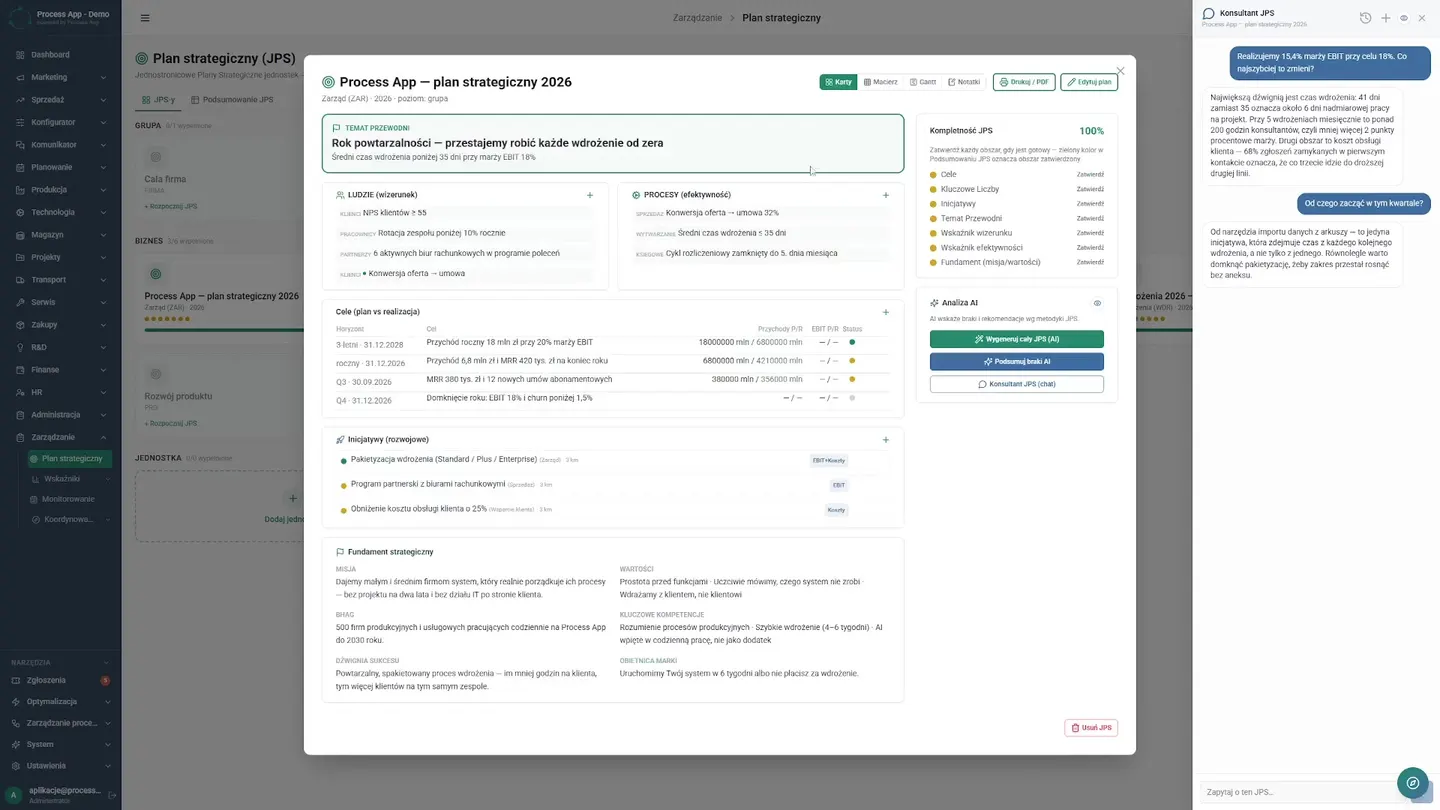
In the past, changing priorities required meetings and transcribing conclusions. Now the director quickly edits objectives, saves new values, and returns to the table. Instead of analyzing changes independently, a single click summons the AI assistant, which immediately supports verification of the new assumptions, saving valuable time.
Ready-Made Summaries
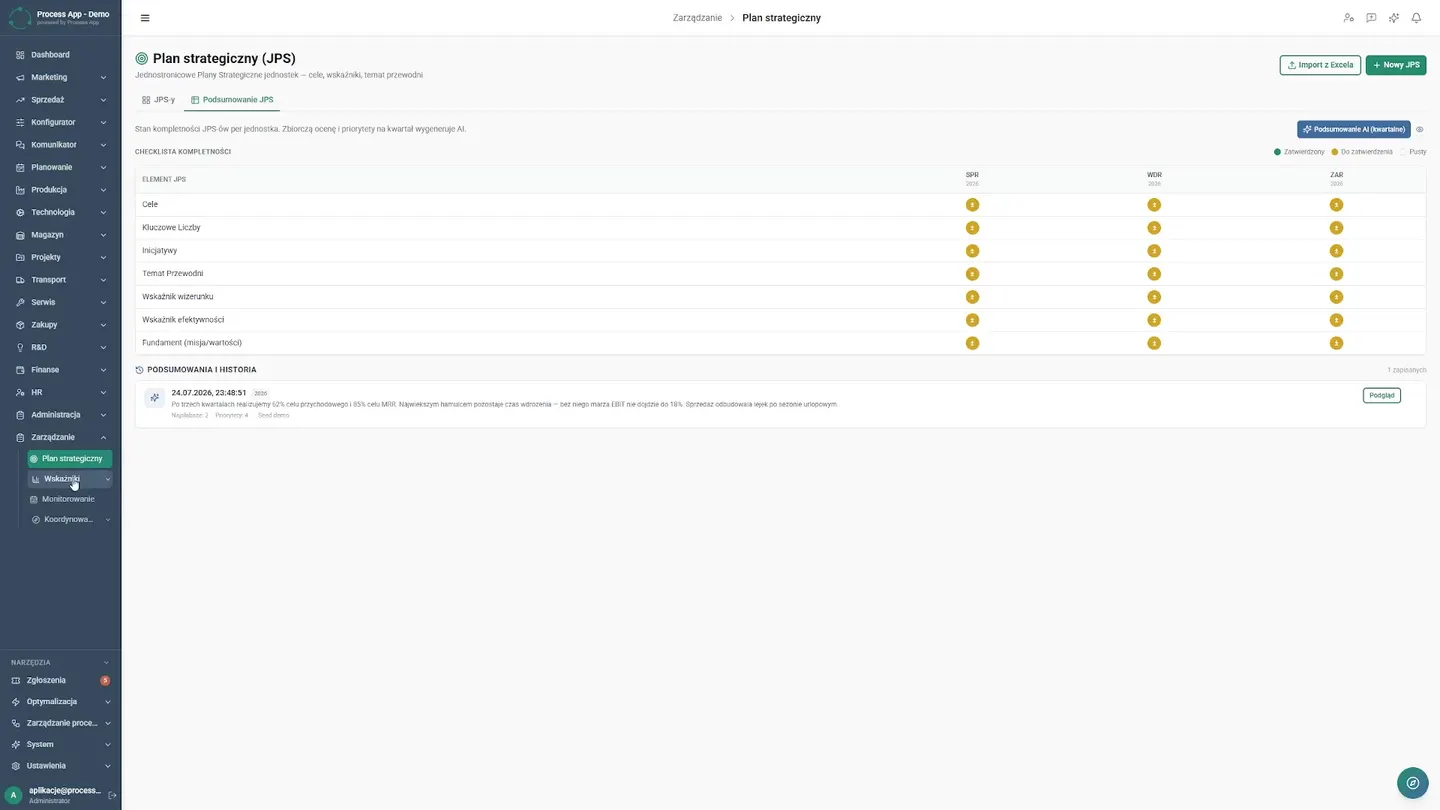
Translating strategic plans into concrete operational actions has always been a bottleneck in the company. Today, the board does not wait for schedules from project managers, because the tool automatically generates charts and arranges initiatives on an interactive Gantt diagram. It is clear what stage each planned task is at and whether key deadlines are at risk. The real breakthrough comes during situation assessment. Instead of asking analysts for complex reports, the director opens the built-in strategic plan summary. The system collects data from the KPI cascade, achieved objectives, and current financials, generating a ready document. This screen delivers conclusions to the board, highlighting areas that require attention. Detected variances can be immediately analyzed and converted into specific corrective tasks. What once took a week of analysts' work is now ready on the spot. The company has gained a central environment that supports decision-making. Problem response time has dropped dramatically, and management runs the company based on hard facts, not guesswork.
Results Achieved
What changed
Before the deployment
- Strategic objectives and KPIs were scattered across multiple spreadsheets, making it difficult to monitor progress and interdepartmental connections.
- Analyzing financial issues and delegating corrective tasks required lengthy meetings and manual transcription of conclusions.
After the deployment
- The board has constant, visual oversight of goal achievement and the company's financial health through automatic summaries and metric dependency maps.
- Detected variances are immediately analyzed within the system and seamlessly converted into specific tasks for teams.
Screens from the deployment