How a B2B Company Eliminated Chaos and Cut Report Generation Time
See it on video
A step-by-step walk through the module — the same screens this write-up describes.
What is in the recording
- 0:00No More Chaos in Reporting
- 0:05A Project Manager's Morning
- 0:22Everything in One Place
- 1:07Smooth Workflow and Kanban
- 1:31Schedule Visualization on the Gantt Chart
- 1:41Full Control Over Delivery and Checklists
- 2:26Automated Reports and Budget
- 3:08Build This Order in Your Own Company
The Challenge
Integrating tasks, files, and budgets in one system eliminates micromanagement and drastically reduces the time spent creating client reports.
Task, file, and budget management was handled across separate tools and spreadsheets. Collecting information on hours worked, costs, and project status for client reports required manual data re-entry, which consumed time and delayed billing.
Key challenges:
- Task, file, and budget management was handled across separate tools and spreadsheets.
- Collecting information on hours worked, costs, and project status for client reports required manual data re-entry, which consumed time and delayed billing.
How the deployment ran
The ProcessApp platform was implemented, combining tasks, files, meetings, and checklists in a single view. An integrated financial module was launched for tracking budgets and costs, along with a feature for generating detailed client reports directly from the system.
Step by step
The steps taken by the implementation team — from mapping the process to going live.
The existing project lifecycle was mapped and migrated into a single work environment.
Kanban boards were configured for task tracking, expense categories were standardized, and report templates summarizing project delivery were prepared.
What works after go-live
What actually works in the system after the deployment — every one of these screens appears in the recording above.
A Project Manager's Morning
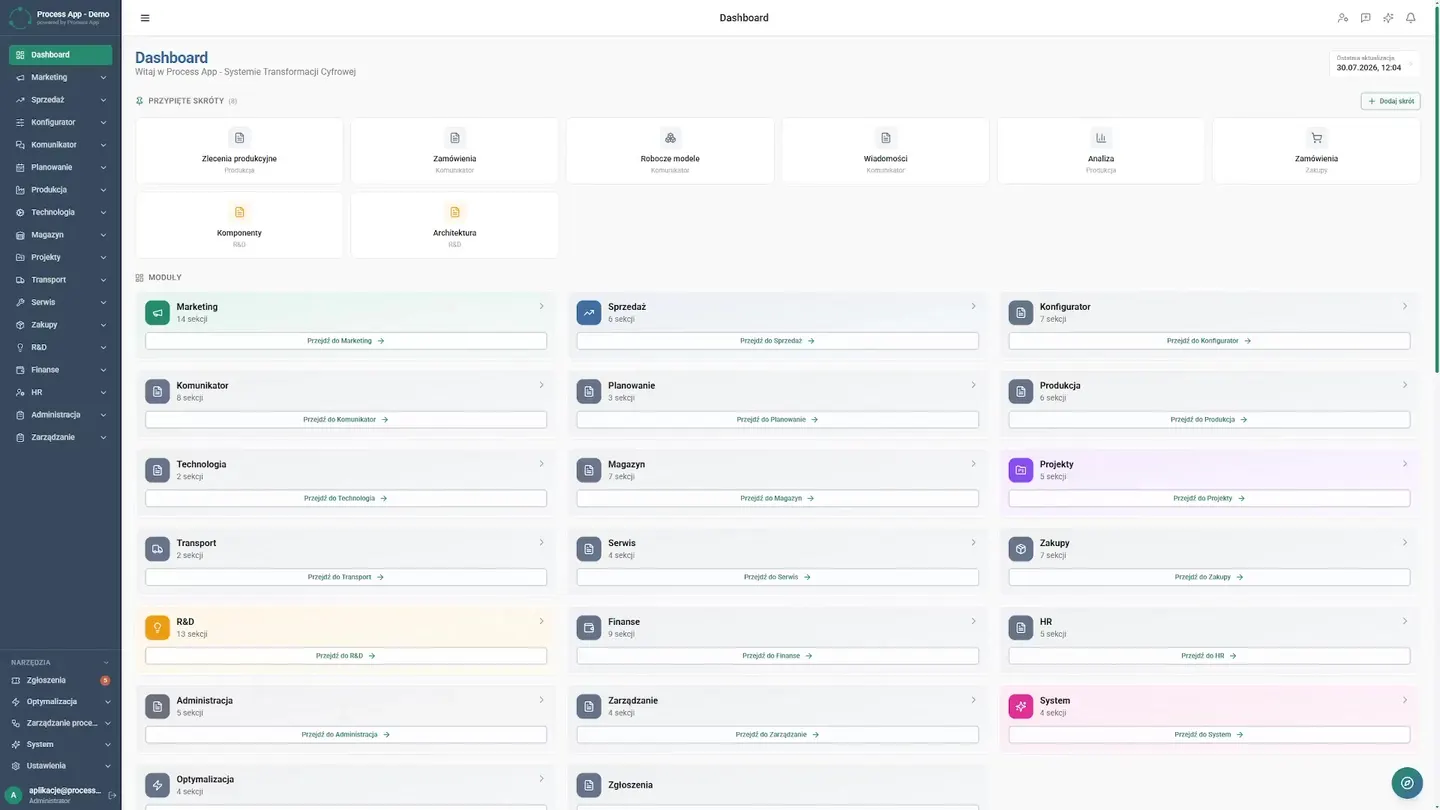
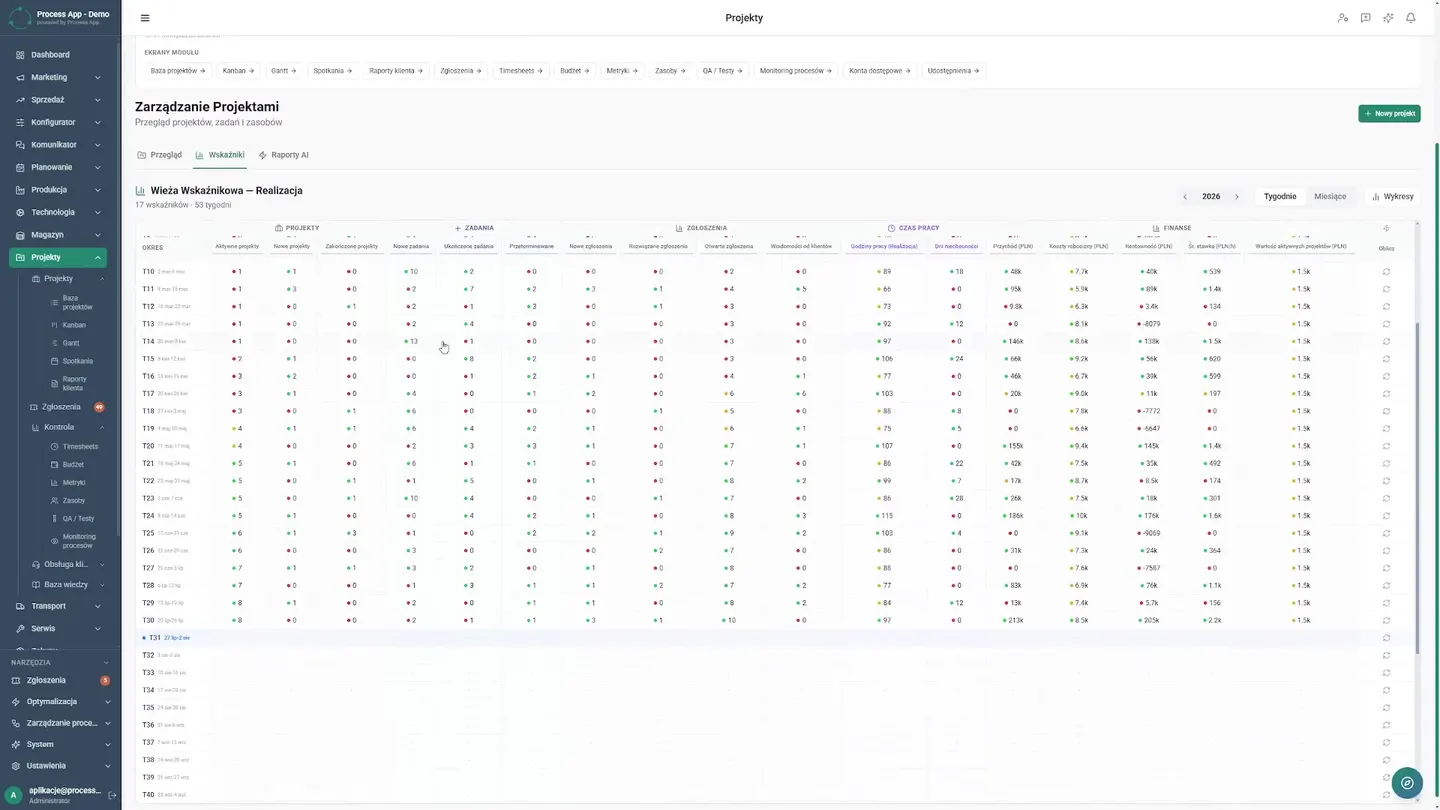
The manager starts the day from a single, integrated dashboard showing the number of active projects, completed tasks, and client satisfaction levels — something that previously took an entire morning and now takes just a moment.
Everything in One Place
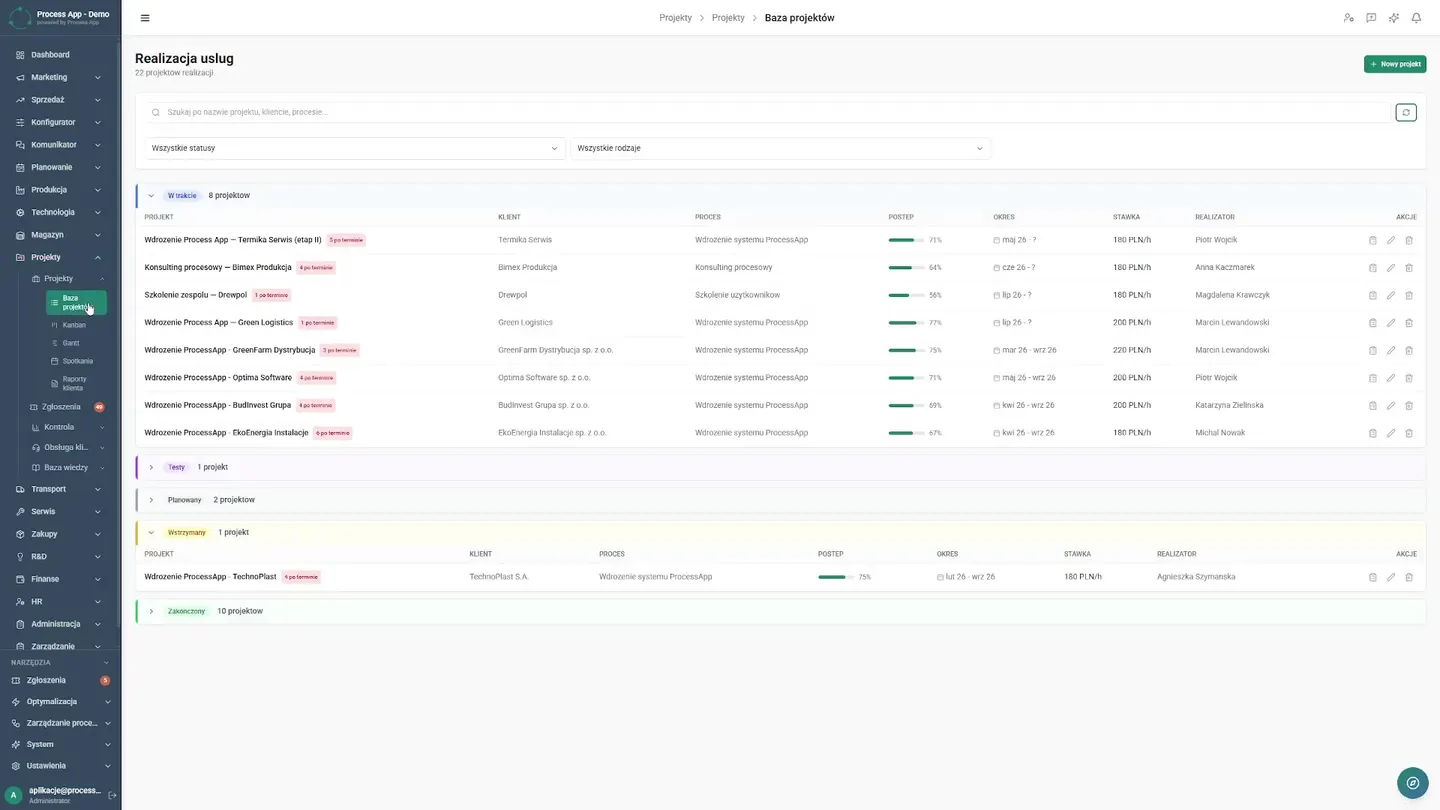
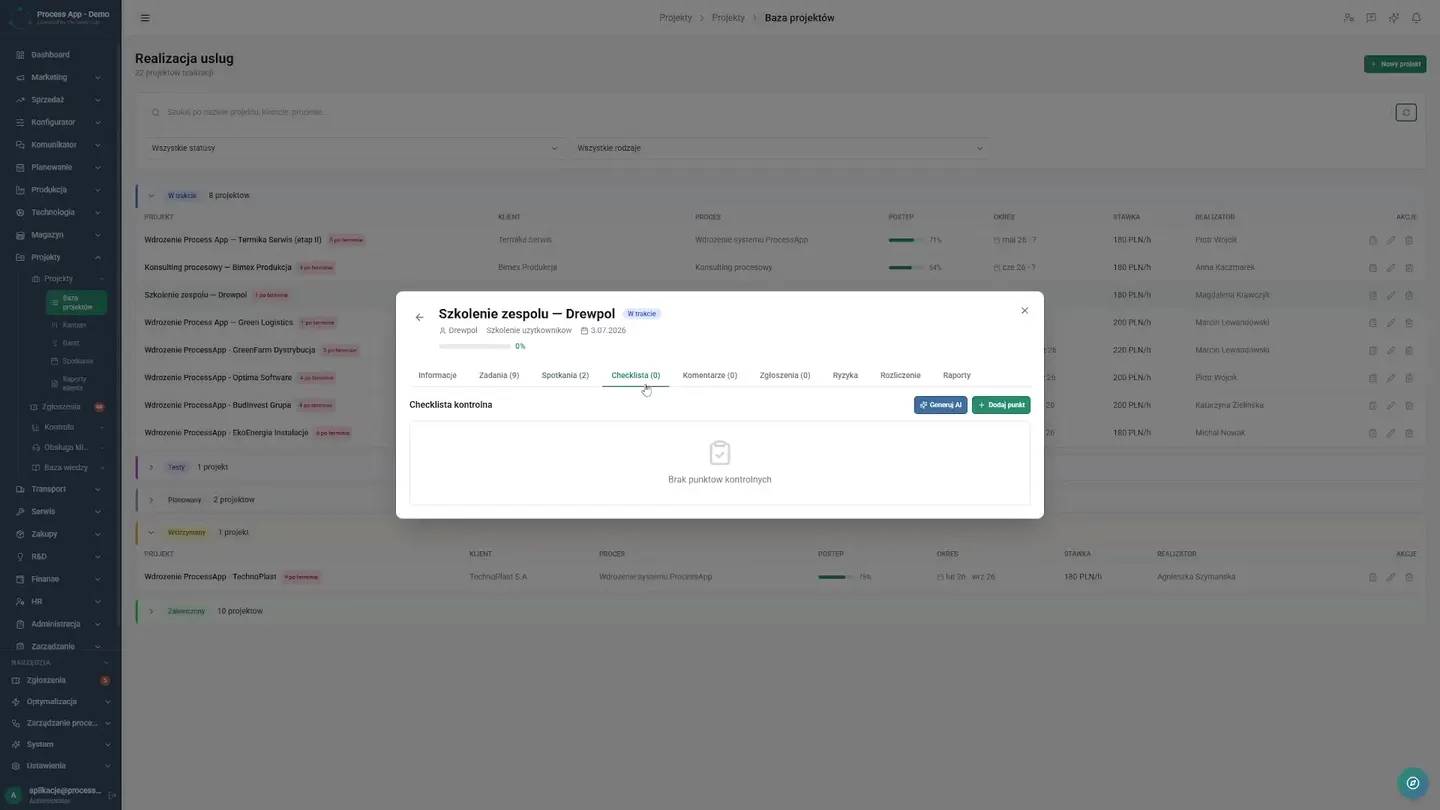
Important decisions used to get lost in hundreds of emails; now it takes just one click on a project in the table to open its full history. The team smoothly browses through tabs and has everything at hand: assigned tasks and meeting notes, including key details from the kick-off. No more frantic searching for decisions before a client call. A clear plan, a current summary, and a control checklist allow anyone to get up to speed instantly. This view has eliminated questions about files, and the flow of information is transparent, allowing managers to focus on delivering results.
Smooth Workflow
In the past, work statuses were checked in lengthy meetings; today the team uses a clear Kanban board. An employee opens a task and drags the card to testing, so the entire company knows what stage an order is at, eliminating dozens of unnecessary calls and messages.
Schedule Visualization
The Gantt chart displays the schedule and dependencies between tasks, and the team monitors progress to avoid delays for the client.
Full Control Over Delivery
The manager verifies progress in real time by moving through the plan and summary tabs, allowing an immediate view of what has been completed. The key element is a detailed control checklist that ensures no project stage is overlooked. Previously, quality verification required reviewing multiple files; today a quick glance at the checked items in the system is enough. This mechanism freed managers from micromanagement and gave them confidence that delivery is proceeding to standard, granting the team autonomy and the company a guarantee of service quality.
Automated Reports and Budget
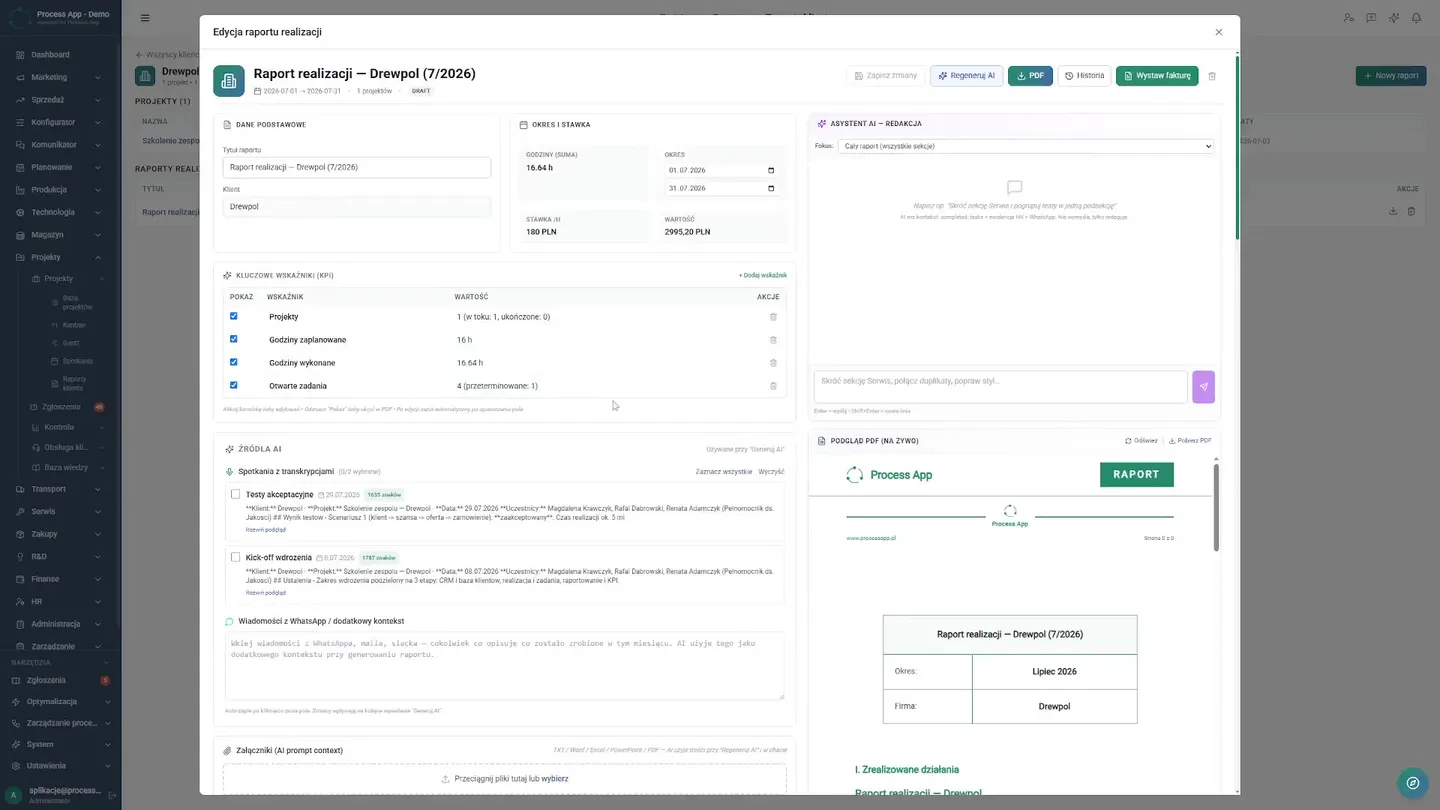
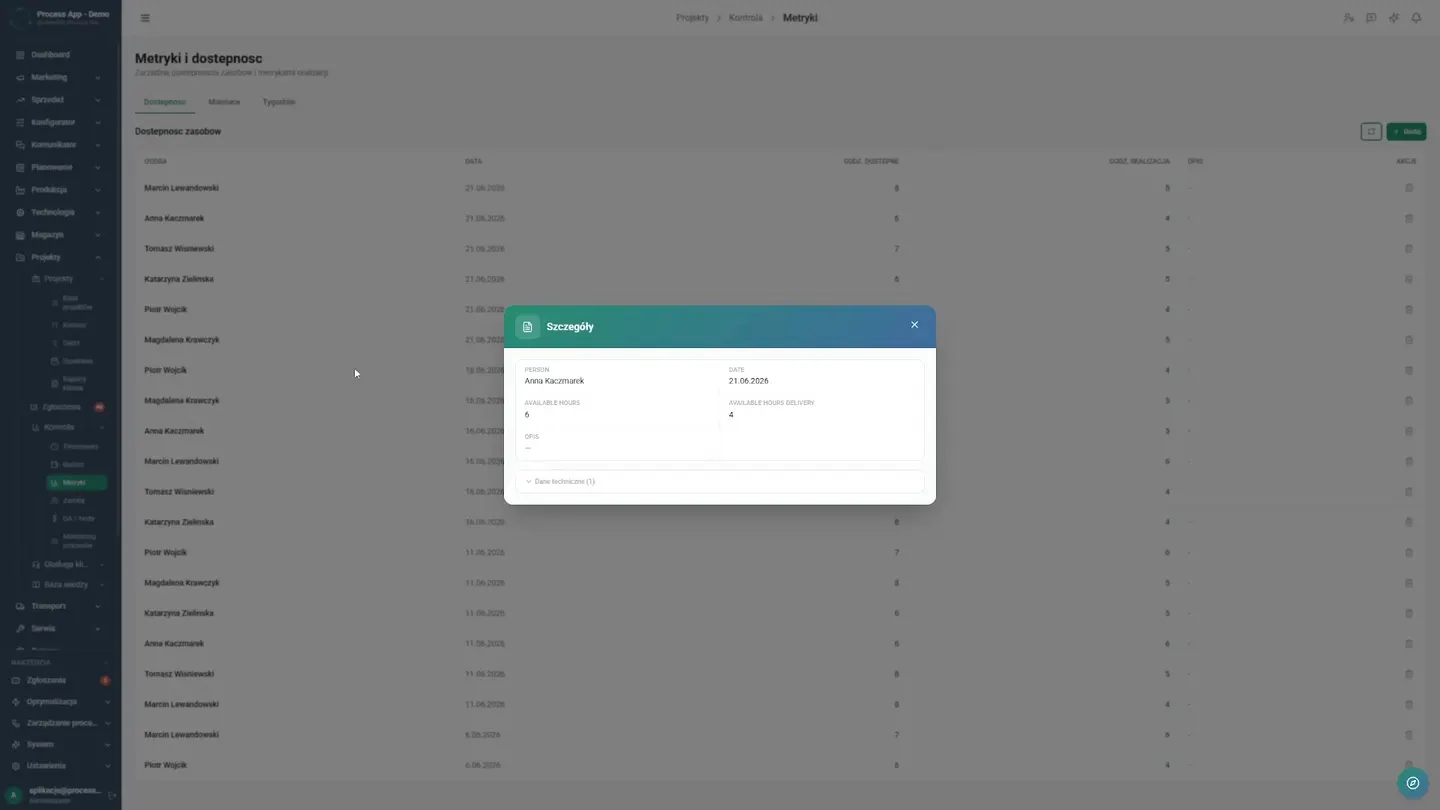
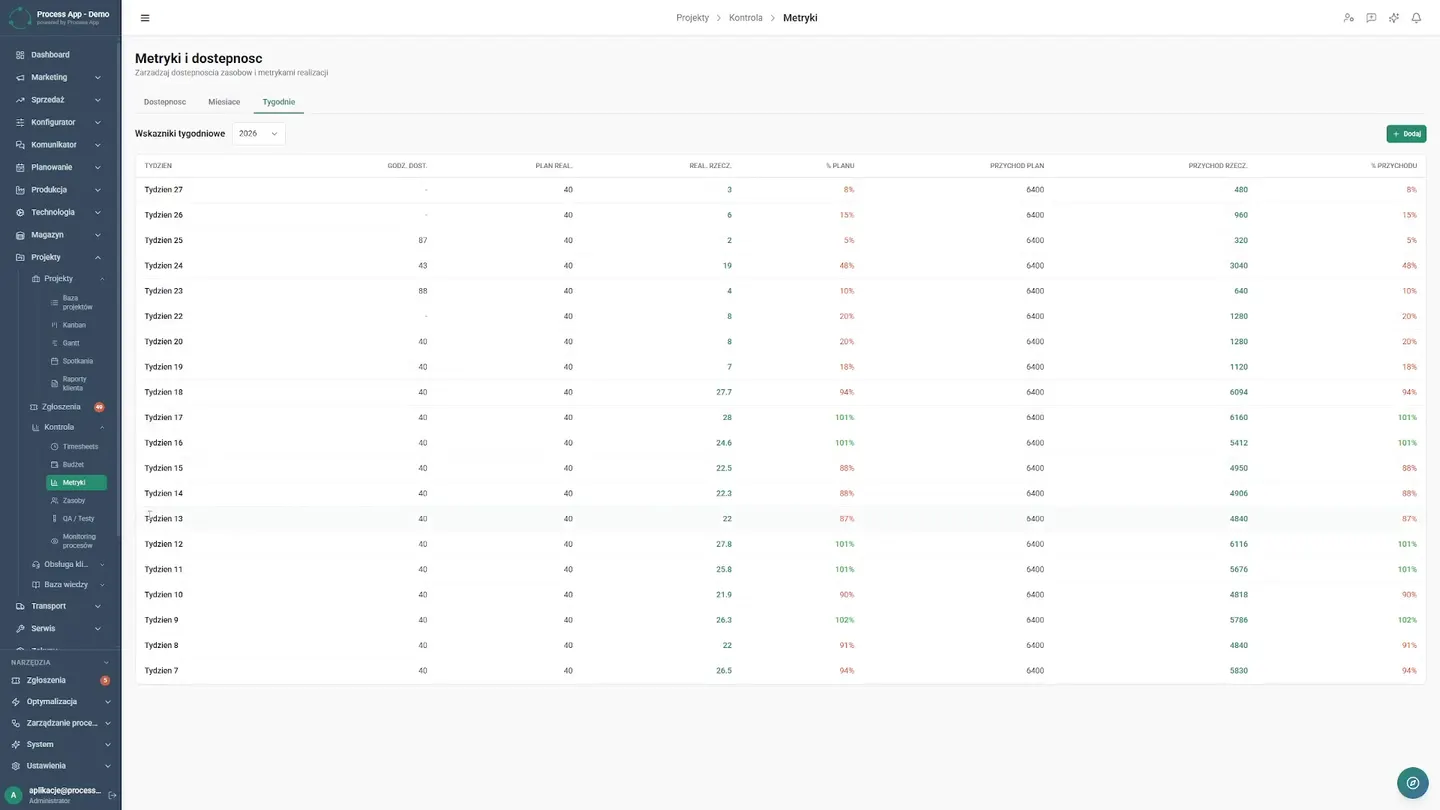
Finally, they handle the final settlements. Instead of manually re-entering data, the system generates a delivery report for the client. The manager reviews the timesheet and analyzes the budget and expenses based on real numbers. Resource availability metrics and indicators in a clear table provide control over order profitability. AI-generated reports summarize the most important data. What used to take days is now produced in moments, enabling faster billing and freeing up hours to be invested in new, profitable ventures.
Results Achieved
What changed
Before the deployment
- Task, file, and budget management was handled across separate tools and spreadsheets.
- Collecting information on hours worked, costs, and project status for client reports required manual data re-entry, which consumed time and delayed billing.
After the deployment
- The company has a real-time overview of project statuses, hours used, and remaining budget on a single dashboard.
- The team manages work smoothly using Kanban boards, and client reports are generated from actual system data, eliminating manual compilation of summaries.
Screens from the deployment