How to Automate B2B Finance and Reclaim Time | Case Study
See it on video
A step-by-step walk through the module — the same screens this write-up describes.
What is in the recording
- 0:00The end of spreadsheet weekends
- 0:21Full control over revenue and costs
- 0:47Automating invoices, taxes and commissions
- 2:09Advanced analysis and management dashboards
- 3:02AI reporting and fast business decisions
The Challenge
Replacing scattered spreadsheets with a single system allows finance departments to reclaim time and enables management to make informed decisions based on real-time data.
Financial data was scattered across spreadsheets and accounting software, forcing manual consolidation of results. The finance department wasted time on tedious commission calculations, tracking unpaid invoices and preparing reports, while management had no real-time visibility into liquidity and budget execution.
Key challenges:
- Financial data was scattered across spreadsheets and accounting software, forcing manual consolidation of results.
- The finance department wasted time on tedious commission calculations, tracking unpaid invoices and preparing reports, while management had no real-time visibility into liquidity and budget execution.
How the deployment ran
A financial module was implemented in ProcessApp, centralizing the management of revenue, costs, invoices and taxes (VAT, CIT, social security contributions). Manual spreadsheets were replaced with interactive dashboards for profitability analysis, budgeting and payroll management, supplemented by an AI-assisted reporting feature.
Step by step
The steps taken by the implementation team — from mapping the process to going live.
Existing processes for cost categorization, tax settlements and invoicing were mapped.
The budget structure was then configured in the system, automatic rules for calculating sales commissions were defined, and analytical views for management were prepared.
What works after go-live
What actually works in the system after the deployment — every one of these screens appears in the recording above.
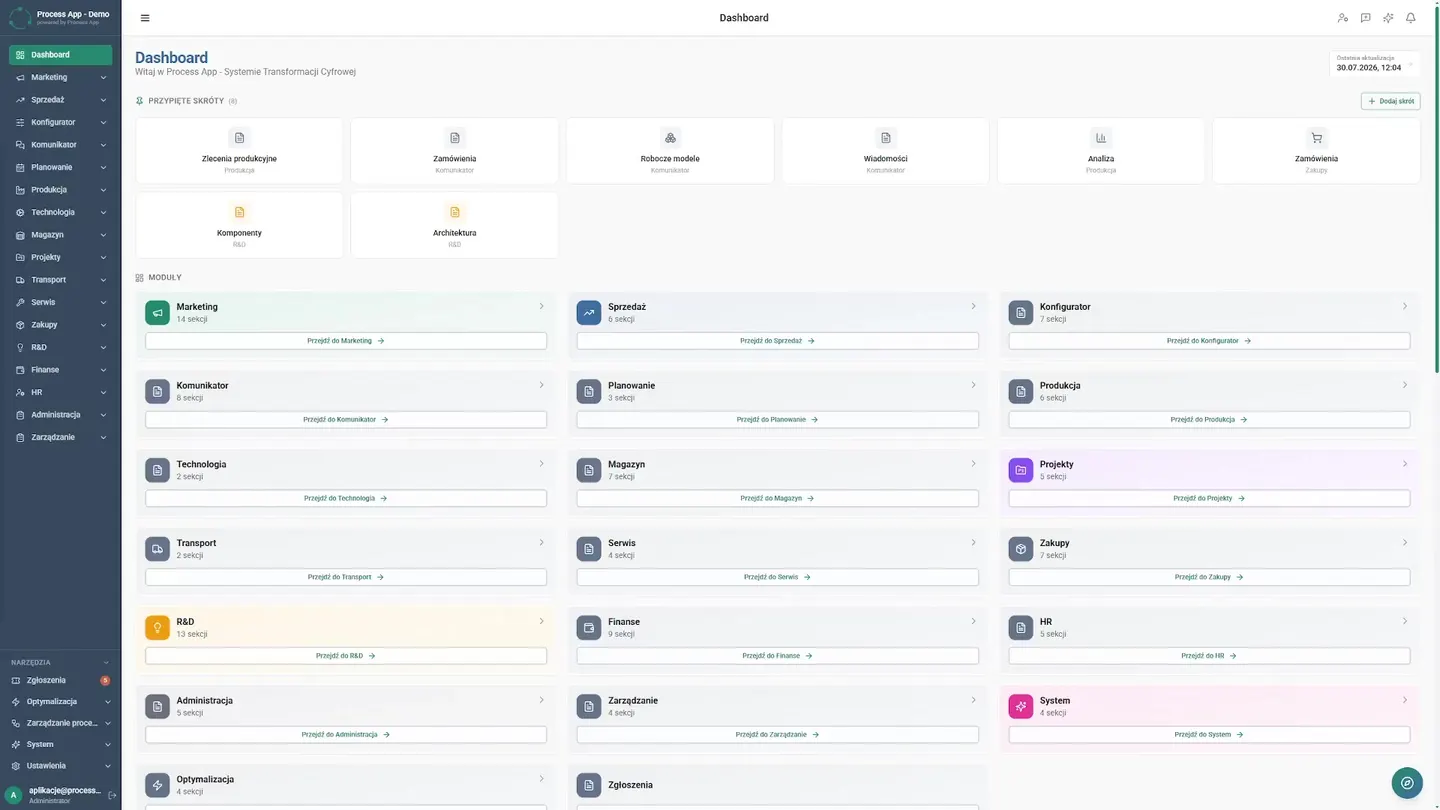
Main Dashboard
Where the CFO used to spend weekends consolidating results, they now start Monday with a single view displaying current revenue, costs and profit on a clear chart.
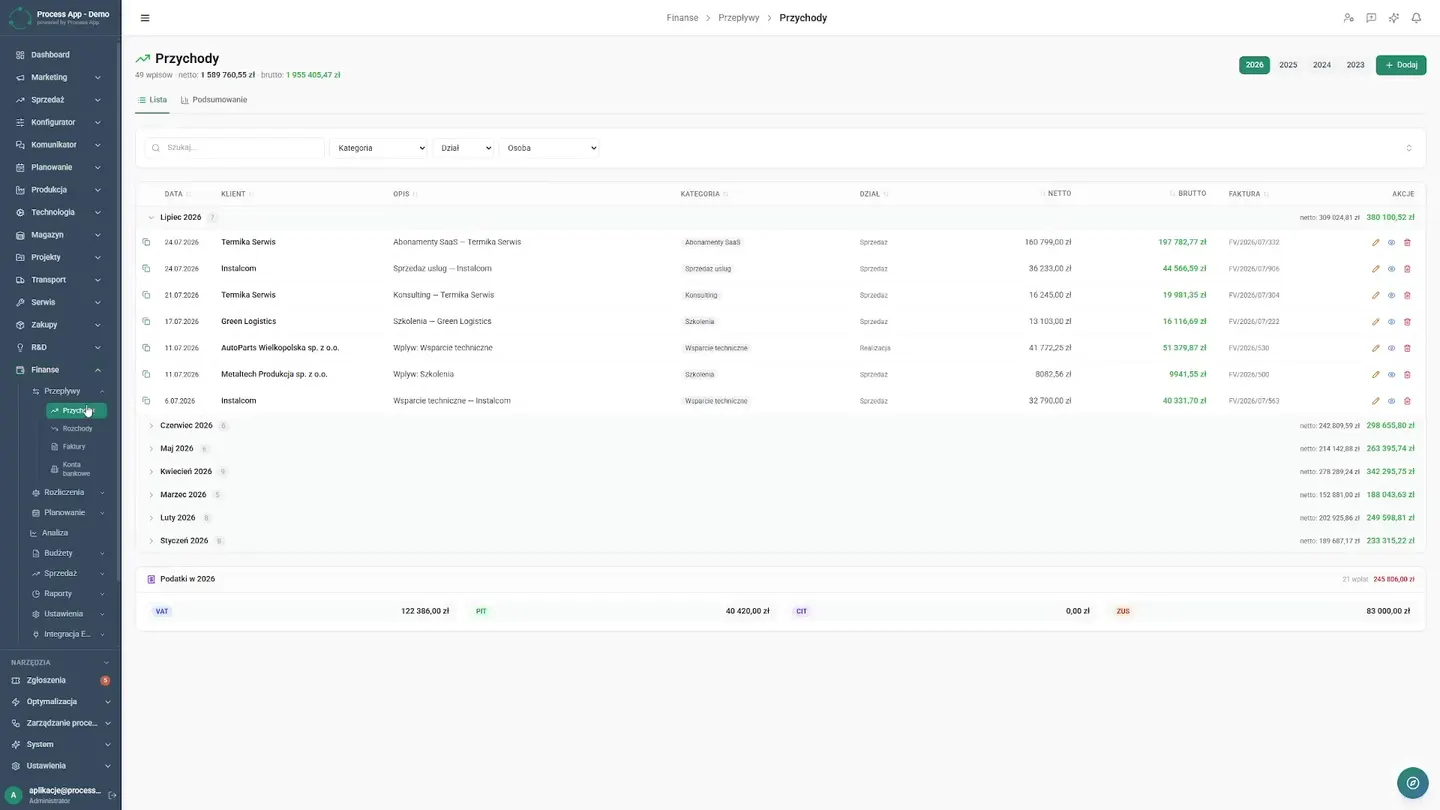
Revenue and Costs
The billing team now has all revenue and costs in one place, creating a single source of truth. The transaction list enables quick verification of operational details, while the analytical summary with trend charts shows the direction of the organization. The finance department gained full control over cash flows, eliminating errors from manual data re-entry.
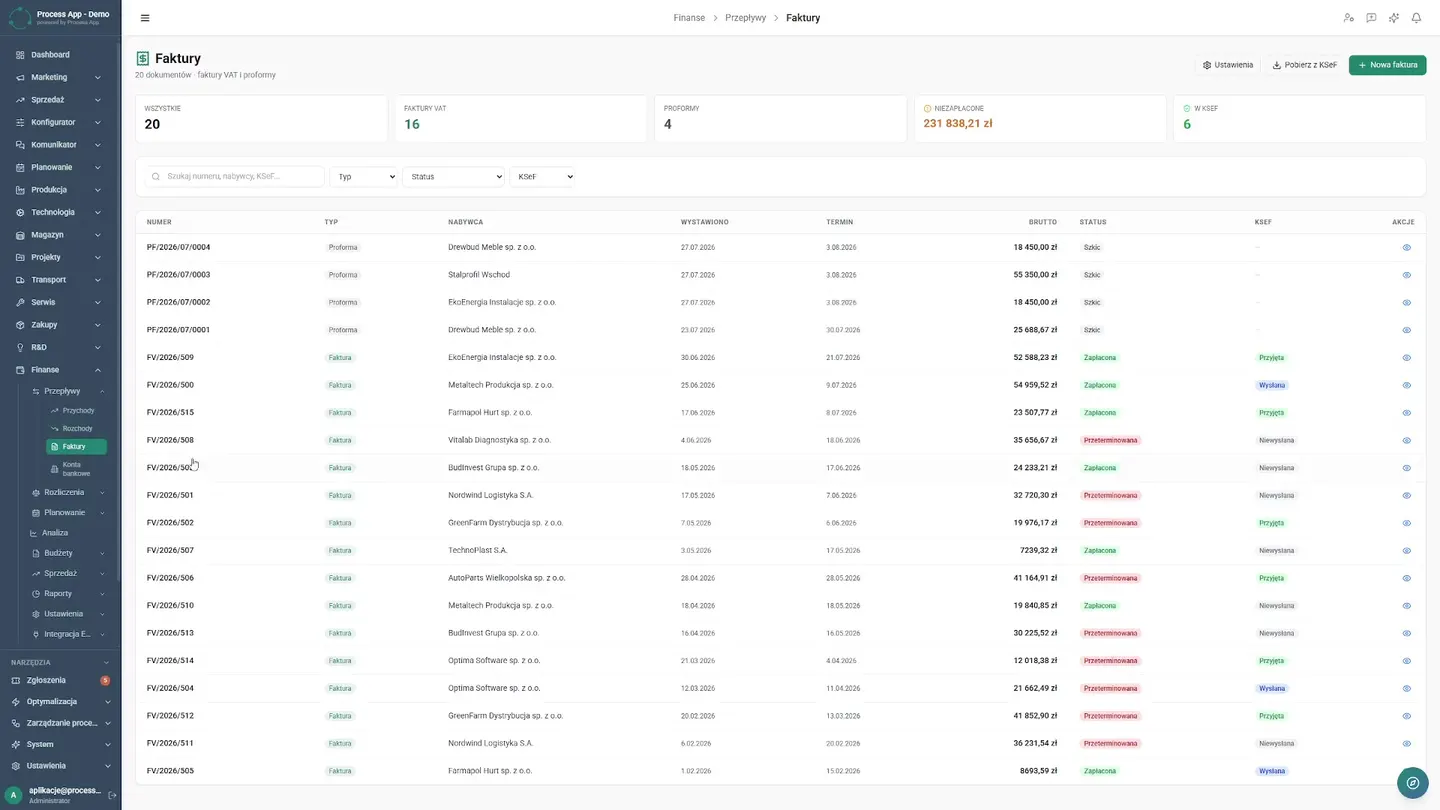
Invoices and Receivables
The system now tracks unpaid invoices automatically, and the billing department can see the full document history. Automatic grouping of overdue amounts by client saves time, and the company knows who owes how much, enabling fast responses and sound cash flow management.
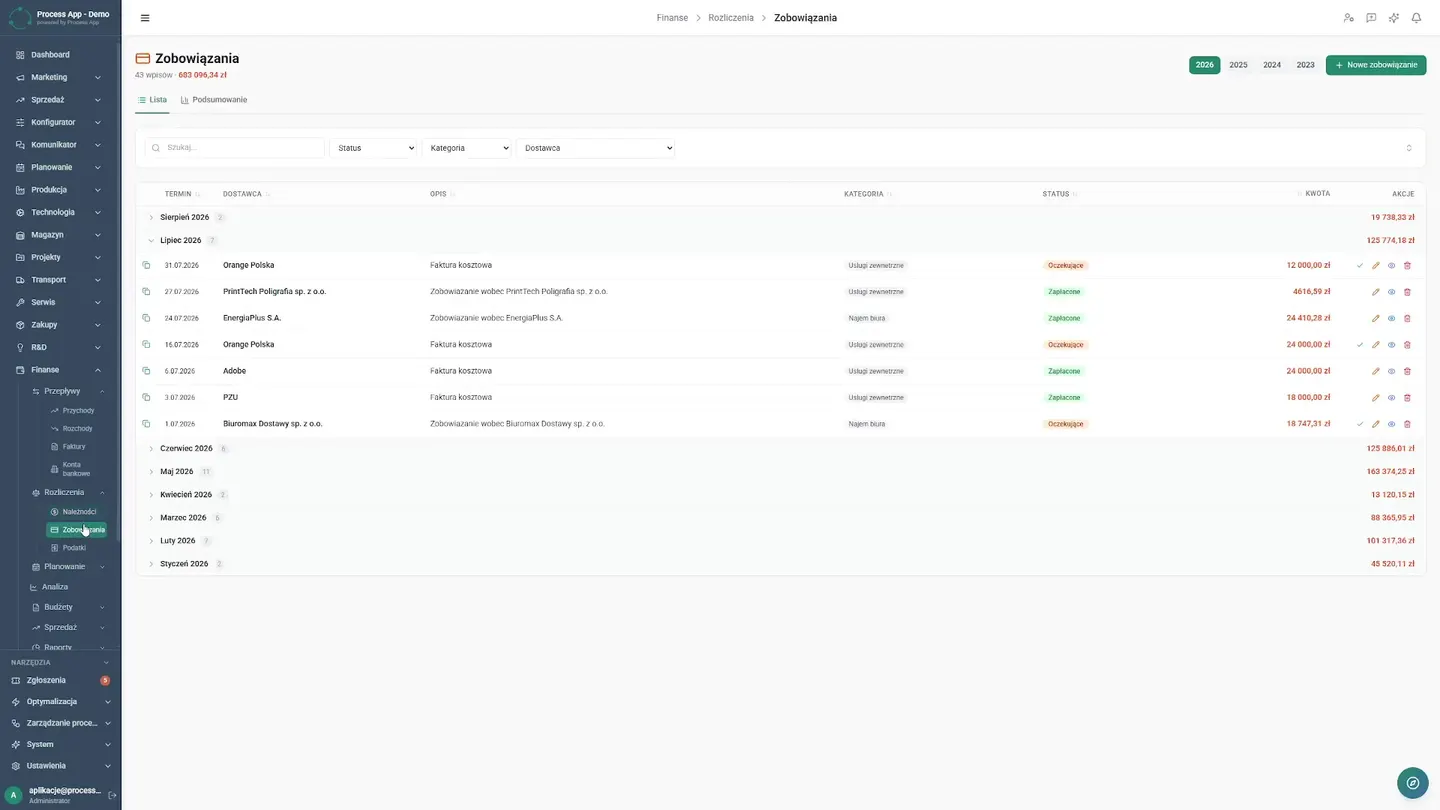
Liabilities and Taxes
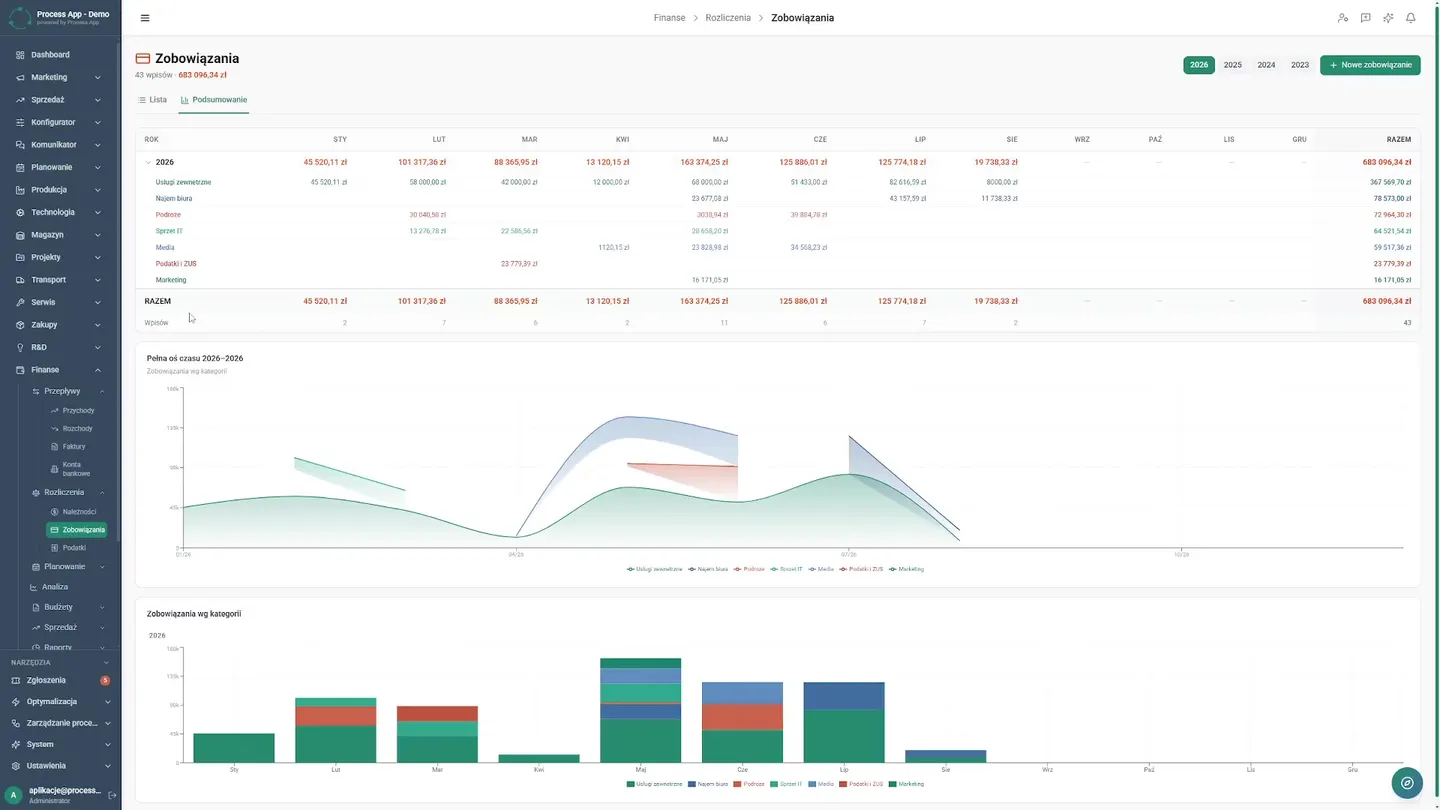
The team automated the liabilities and tax process, aggregating information on VAT, CIT and social security obligations. Clear charts and tables provide confidence that everything is paid on time, eliminating the risk of errors and letting the accounting team rest easy.
Budgets and Payroll
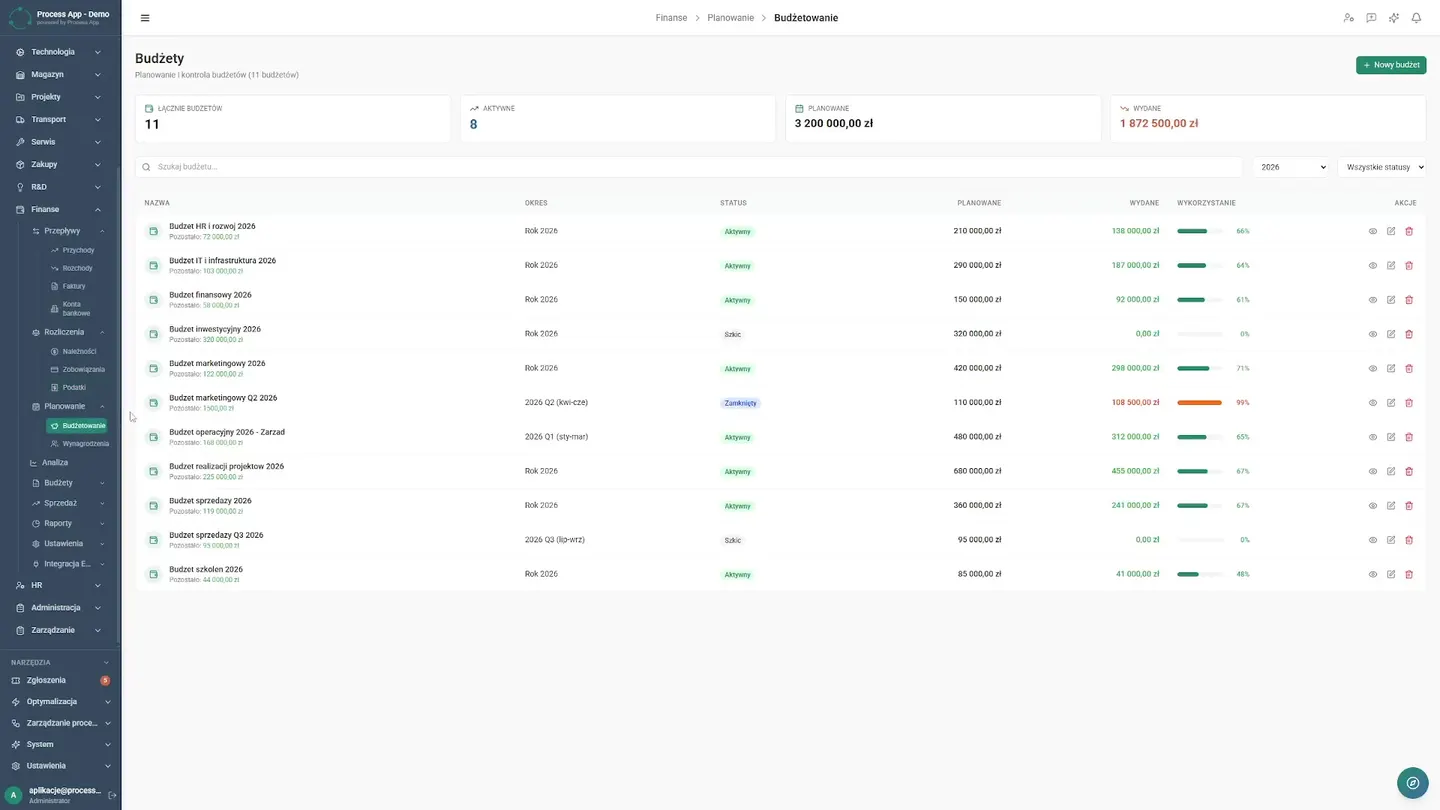
The finance department previously spent hours calculating commissions in spreadsheets. Now budgets and salaries calculate themselves, and execution status is available at all times. Configured automatic commission rules ensure accurate, on-time payouts, allowing the team to focus on real analysis rather than manual data re-entry.
Advanced Analysis
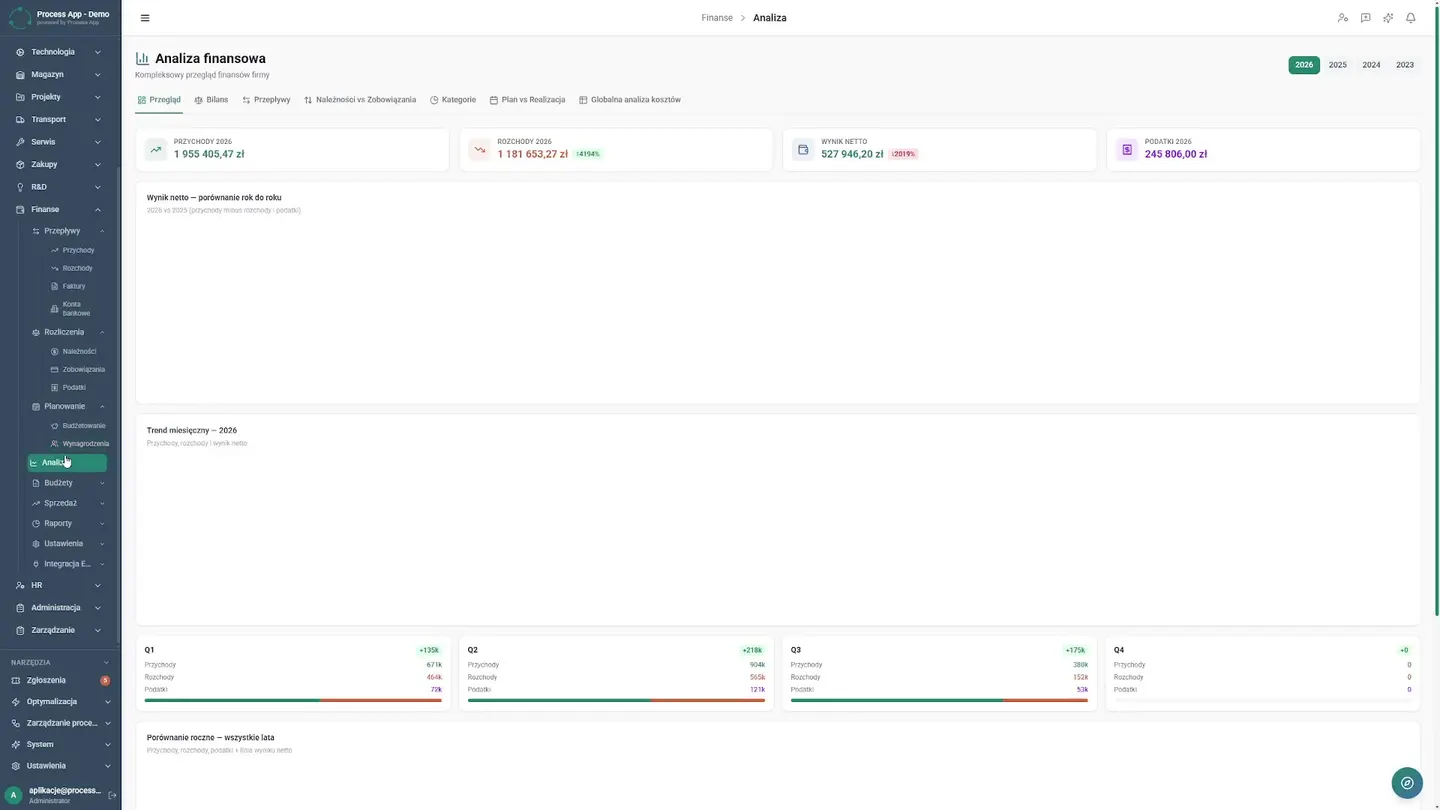
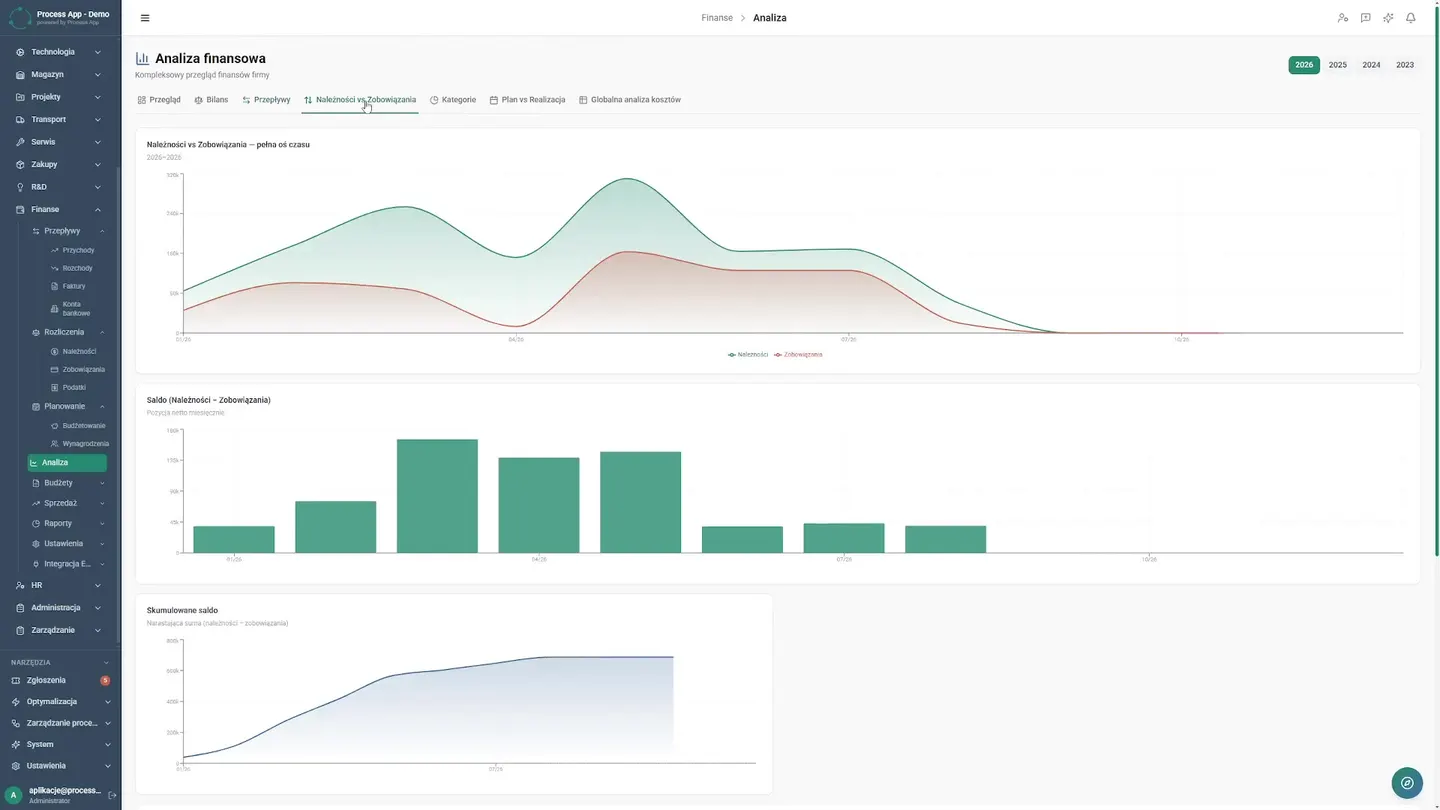
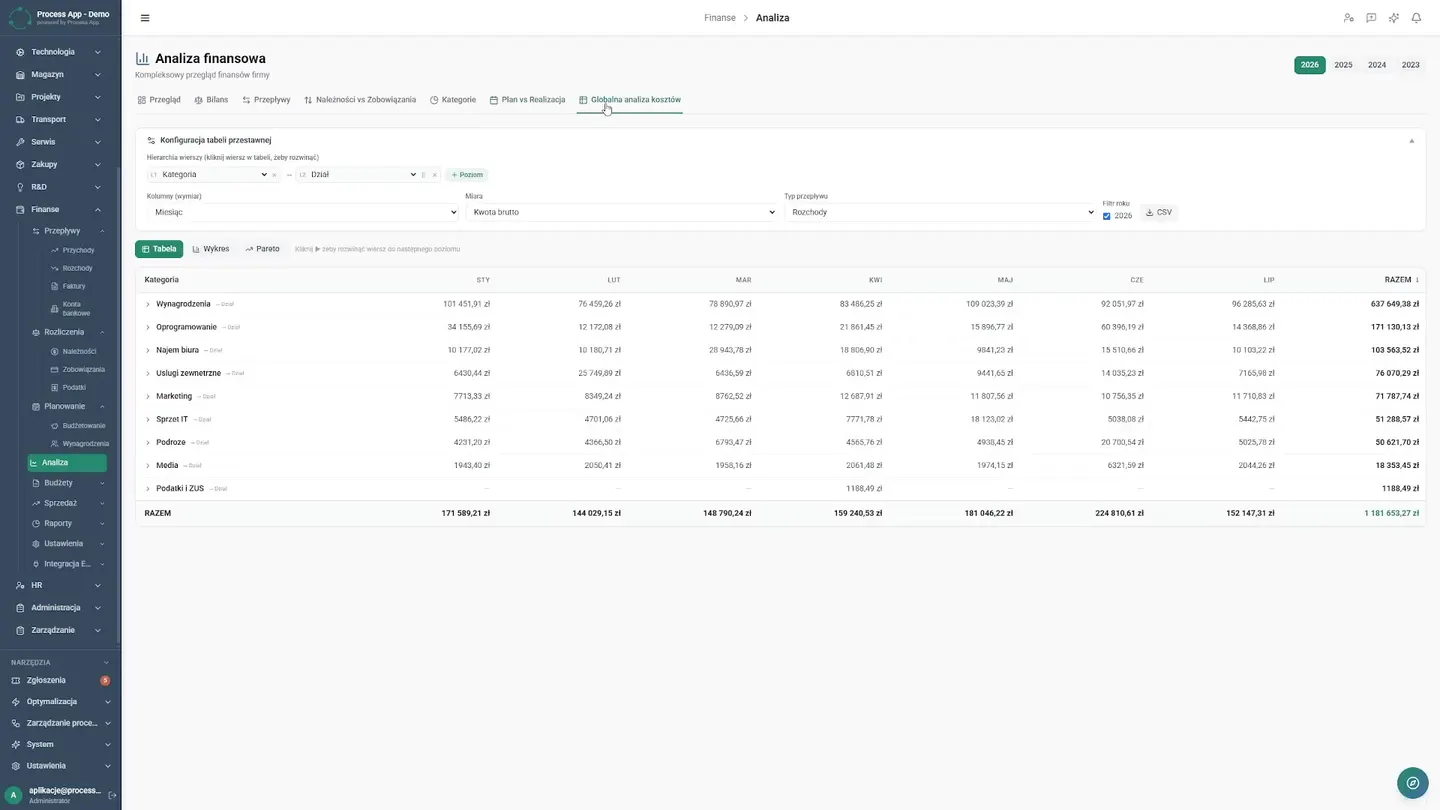
The enormous time savings allow the CFO to use a comprehensive analytical dashboard that is ready before the morning coffee is finished. Switching between tabs, they examine results, revenue structure and the ratio of receivables to liabilities. Visualizations quickly reveal project and category profitability. The team can see where the company earns the most and where costs are getting out of control. Deep real-time liquidity analysis — previously impossible due to scattered files — now enables management to understand the company's financial health without waiting weeks. All knowledge about costs and margins is available with a single click, supporting investment planning and sustainable business growth.
AI Reports and Plan
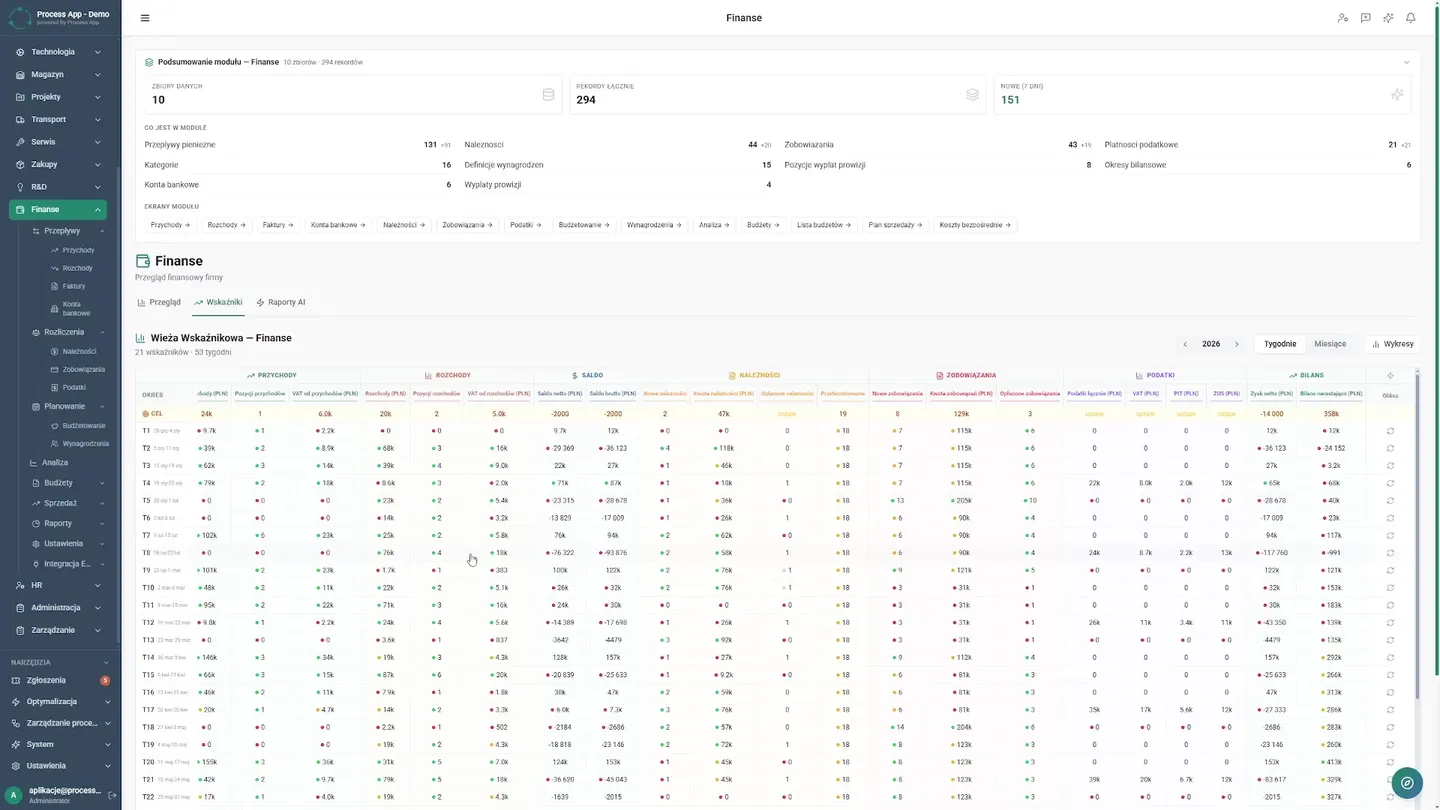
The crowning achievement of the digital transformation is full transparency for company management. Plan analysis compares assumptions against actual results in charts and tables. Key financial indicators provide data for decision-making. The artificial intelligence module generates reports with summaries and recommendations, enabling management to quickly make key decisions based on facts.
Results Achieved
What changed
Before the deployment
- Financial data was scattered across spreadsheets and accounting software, forcing manual consolidation of results.
- The finance department wasted time on tedious commission calculations, tracking unpaid invoices and preparing reports, while management had no real-time visibility into liquidity and budget execution.
After the deployment
- The billing department no longer needs to manually compile data for reports, and commission calculations and receivables monitoring are handled within a single system.
- Management has constant, immediate access to liquidity indicators, plan-versus-actual comparisons and summaries generated by artificial intelligence.
Screens from the deployment