
What Is an Ishikawa Diagram?

Have you ever wondered how to effectively solve complex problems in your company? Do you struggle with identifying the root causes of recurring errors, while your team spends countless hours spinning theories and making assumptions?
If you want to spark your employees' creativity while also enabling a structured, clear-cut analysis of problems, it's worth putting the Ishikawa diagram on the table. It's a tool that will help not only save precious hours in meetings, but also verify which category of causes is most relevant to your problem. You might think a fish is only an ally of an empty stomach — yet it can also be one in certain areas of business. Let's walk through it together, from the basic principles to examples and automation of its use:
Why — and When — Should You Use an Ishikawa Diagram?
Structure and Types of Categories in the Fishbone Diagram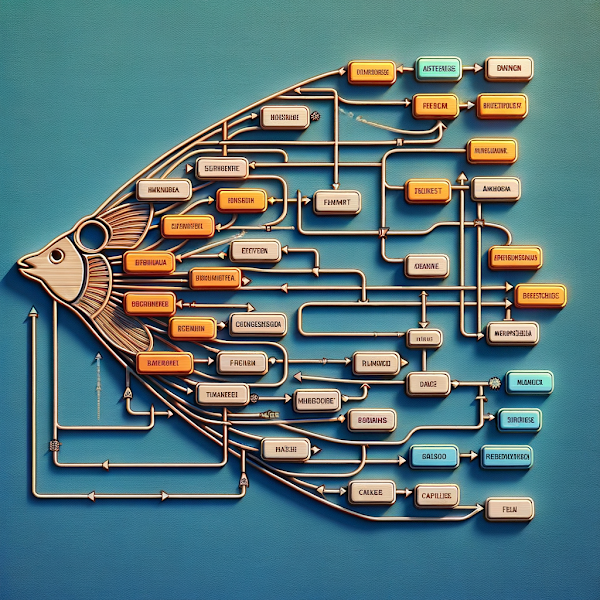
How to Create an Ishikawa Diagram Step by Step
AI Application – Automating the Ishikawa Diagram
5 Benefits of Using the Ishikawa Diagram
Have you ever needed to take a closer look at solving a complex problem at work? You've probably also wondered in which situations it would be best to use the Ishikawa Diagram. There are moments when we need to view the data and areas available to us from a bird's-eye perspective. When we want a broader context and a wider view of the situation. It often turns out that a given problem isn't caused by just one factor, but by several. In such cases, it's helpful to have a global overview of all areas.
At the management level, it is essential to skillfully identify not only the symptoms but, above all, the sources of shortcomings in procedures. One proven way to organize thoughts and data is the Ishikawa diagram, also known as the cause-and-effect diagram or fishbone diagram.
This graphical way of presenting problems is not just an analytical tool; it is a map that guides you through a thought process requiring an understanding of the relationships between the various elements that influence the final outcome.
Why is it worth using? First and foremost, because it allows all potential causes of a problem to be gathered in one place, which in turn facilitates its systematic analysis and resolution. The advantage of this approach is its universality regardless of industry. Whether in manufacturing, finance, or services, the Ishikawa diagram can help uncover the root of problems. Project managers, business analysts, and those responsible for quality control will all find invaluable support in it.
This tool can also prove extremely helpful during brainstorming sessions, where group analysis gains a visual foundation. What's important is the fact that using this tool encourages teamwork and cross-departmental communication, which is particularly valuable in corporate environments where processes are complex and multidimensional.
But how do you go about creating such a diagram? What categories should be considered, and what steps should be taken to develop an effective cause-and-effect diagram?
The Ishikawa diagram consists of a main line representing the problem to be investigated, from which diagonal lines branch out. These lines represent the main categories of causes. Traditionally, six such categories are distinguished, known as 5M + E: Method, Materials, Machines, Manpower, Measurement, and Environment. Each category is further broken down into subcategories, which allow for a deeper analysis of the potential causes of the problem.
Method – Relates to procedures, instructions, and strategies. Consider here whether the working methods used are adequate for the tasks and objectives.
Materials – Refers to raw materials, components, and software. Could the quality and properties of the materials be influencing the problem?
Machines – This is where the tools and equipment being used are analyzed. It raises questions about their condition, suitability, and maintenance.
Manpower – Focuses on employee engagement, their skills, and interactions. How do these influence the identified problem?
Measurement – This category examines measurement and process monitoring systems.
Environment – This takes into account the external and internal conditions of the company that may have an impact on the problem.
Is it possible that errors are appearing at this stage?
Remember that although the 5M + E categories are widely used, the diagram can be adapted to the specifics of an industry or the nature of the problem by introducing new categories. The key is that each of the main lines in the diagram reflects a real, potential cause of the problem, enabling a holistic approach to its resolution. In the following sections of this article, we look at how to effectively analyze these categories and build a useful Ishikawa diagram that will help identify the true source of problems within your company.
How to Create an Ishikawa Diagram Step by Step
When creating an Ishikawa diagram, a systematic approach is essential. Start by precisely defining the problem you want to investigate and place it at the end of the main line. Then conduct a brainstorming session to generate possible causes of the problem.
Let's now walk through how to do this effectively, step by step:
Identify the problem – Clearly define the main problem, which will be the "fish head." Make sure all participants in the analysis understand its significance.
Prepare the right environment – Organize a workshop with your team and provide the appropriate visualization tools — a large flipchart or whiteboard.
Define the main categories – Use the standard categories (5M + E) or adapt them to the needs of the analysis. Each category forms a "bone" leading to the main line.
Look for second- and third-order causes – For each category, develop subcategories that may be causes of the problem. Think about the specific factors influencing the problem.
Analysis and verification – Once the diagram has taken shape, analyze the possible causes and check their significance. You can use tools such as 5 Why to dig deeper into each issue.
Problem solving – Based on the identified causes, develop possible solutions and action strategies, which will bring you closer to resolving the main problem.
Applying the Ishikawa diagram to business processes is a step toward a deeper understanding and resolution of organizational problems. This analytical method can significantly contribute to improving quality and efficiency within a company. It helps isolate causes from effects, which is invaluable when developing effective strategies to eliminate problems. The process of creating the diagram requires team analysis and engagement, which additionally builds a spirit of collaboration within the team. As a result, companies that adopt this method can count on a more thoughtful and balanced approach to the challenges facing their operations. Isn't this the perfect moment to consider integrating this tool with available technological solutions that can significantly streamline the entire process?
AI Application – Automating the Ishikawa Diagram
In the age of digitalization, where efficiency and time are of paramount importance, the need for automation arises — and this can apply to problem analysis processes as well. Why?
If nothing else, to minimize the time spent in drawn-out meetings during which employees lose their enthusiasm for creative brainstorming, or where their ideas drift too far from the main topic.
Over time, all problem-solving workshops, recurring meetings, and quality circles tend to turn into a minor nightmare rather than an opportunity to collectively define a problem and assign responsibility for corrective actions.
Let's take a specific example — the Wizjer application.
Let's also make one thing clear right away. The goal is not for the tool to "spit out" an answer for the user, who then simply sends an email with the attached analysis to colleagues and clients.
This is meant to be a support mechanism, where — after the team has defined the problem — with the help of the application and the AI module, employees can generate, among other things, an Ishikawa diagram, which they then collectively review and verify. Working with the proposal, they can immediately identify which categories and details are actually relevant to them, and which data needs to be verified further. Once the initial conclusions have been established, there is nothing stopping them from using those conclusions to generate an "updated" Ishikawa diagram in the application.
But how is this possible?
Why not simply watch a short video presenting how the application works:
With the goal of having everything in one place, Wizjer is not only responsible for reporting and summarizing problems. In just a few steps, it primarily allows you to:
Launch a Problem-Solving Project## Guide the Team Through Refining the Problem Description
Generate questions for the Ishikawa diagram based on all available information (about the company, historical data, similar projects, and currently entered data), which then serves as the basis for continuing the brainstorming session
Create a 5 Why analysis as a supplement to the earlier stages of the investigation
Generate proposals for corrective and preventive actions, which — once verified — employees can add to the project plan, assign deadlines and responsibilities
Create task proposals, elaborate on selected steps, or even partially carry them out (such as creating procedures, checklists, or standards)
This is just the beginning. More details require hands-on testing! And that is absolutely possible thanks to the DEMO version.
Run your own analysis in the application — try the DEMO version.
In Summary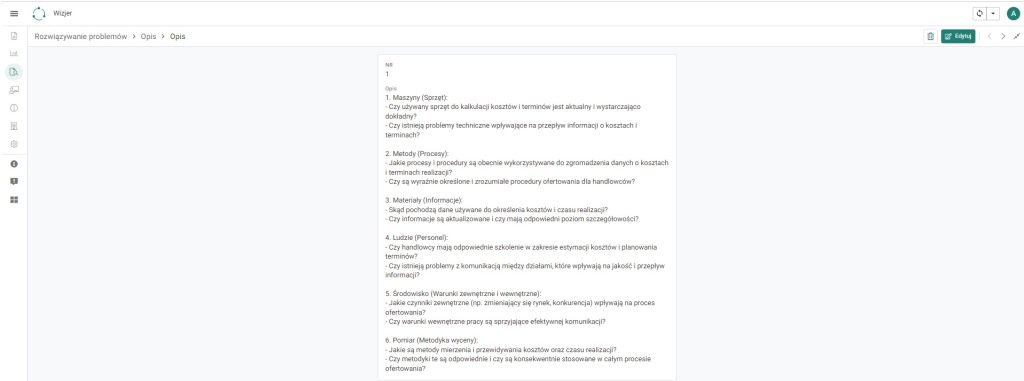
Automating the Ishikawa diagram using an AI application takes traditional analysis methods to a whole new level. The core benefits confirm this:
Idea generation – AI can suggest potential causes of problems based on available historical data.
Quick modifications – Editing diagrams becomes easier and faster thanks to interactive tools.
Data analysis – Artificial intelligence can help analyze large datasets to identify recurring patterns.
Data visualization – Dynamic and eye-catching visualizations aid in understanding complex relationships.
Integration – The application can be integrated with other systems used within the company to ensure consistency and full automation.
Automating the creation of the Ishikawa diagram using an AI application is the next step in the evolution toward efficiency and precision in business problem analysis. Thanks to advanced technologies, the tool in question becomes even more effective, supporting the daily pursuit of operational excellence. Faster generation, flexibility in editing, and deeper data analysis translate into better management and quicker detection of the root causes of potential problems. Adopting such a solution can provide a significant competitive advantage and open up new opportunities for business growth. Let's now look at how to leverage these modern tools to maximize the potential of your company.
Using the Ishikawa diagram brings numerous benefits that can translate into increased business efficiency and better problem-solving. Here are five key advantages that result from applying this method:
Improved communication – By visually presenting problems, the team more easily understands causes and effects, which facilitates collaboration.
In-depth analysis – The diagram drives a deep understanding of problems, encouraging the search for their root causes rather than just surface-level symptoms.
Process improvement – By systematically pinpointing problems, the company can implement changes that streamline operations and increase productivity.
Error reduction – Understanding the root causes of problems contributes to reducing errors and discrepancies in work.
More effective training – The diagram can be used to identify gaps in employees' skills, which can lead to better training planning and competency development.
Using the Ishikawa diagram has a positive impact on the quality of decision-making and operational processes in any organization. This method not only facilitates an understanding of the causes of problems, but also promotes a culture of continuous improvement and team collaboration. Employees become more aware of how their actions affect the final outcome, which can lead to increased engagement and accountability. The Ishikawa diagram is also a tool that can be used across all types of industries, adapting to their specific characteristics. Furthermore, adopting this approach signals that the company is ready for more effective knowledge management and the continuous improvement of its processes.
Is your company ready for these benefits?
We invite you to explore our solutions, which will help you implement this powerful method of problem analysis.


